
Analysing AD and AS Shocks: A Plain-English Guide for Edexcel IAL Economics Unit 2
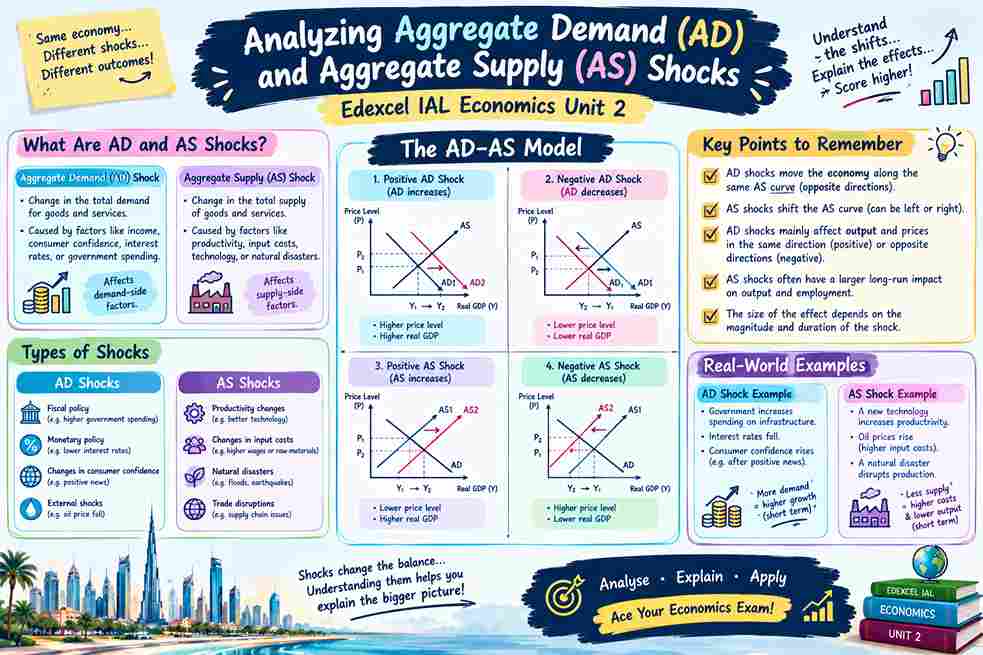
Every week, the news brings a new economic story. Oil prices jump, a government announces a big infrastructure project, a neighbouring country's currency weakens, or consumers suddenly stop spending because they feel nervous about the future. Each of these events can ripple through the whole economy, changing prices, jobs, and how much a country produces.
For Edexcel International A Level (IAL) Economics students, these events are far more than headlines. They are the raw material for some of the most important exam questions in Unit 2. Being able to explain what happens when aggregate demand (AD) or aggregate supply (AS) shifts, and why, is a skill that examiners reward again and again.
The good news is that AD/AS analysis is very learnable. Once you understand a small set of ideas and practise drawing the diagrams clearly, the same logic can be applied to almost any shock. This guide will walk you through it step by step, in plain language, so that you can approach these questions with confidence.
At EdFlik, we know that Economics can feel abstract at first. That is why our tutors work with students one-to-one, building understanding at the student's own pace. Parents often tell us that once the diagrams 'click', their child's confidence grows quickly. Let's make that happen here.
Part 1: The Building Blocks
What is aggregate demand (AD)?
Aggregate demand is the total planned spending on goods and services in an economy at a given average price level. It is made up of four components:
- Consumption (C): spending by households
- Investment (I): spending by firms on capital goods, such as machinery and buildings
- Government spending (G): spending by the government on public services and infrastructure
- Net exports (X - M): exports minus imports
So we can write: AD = C + I + G + (X - M)
The AD curve slopes downwards. When the average price level falls, real spending power rises and interest rates tend to fall, so people and firms buy more. When prices rise, the opposite happens.
What is aggregate supply (AS)?
Aggregate supply is the total output that firms are willing to produce at each average price level. Economists split AS into two time frames:
- Short-run aggregate supply (SRAS): In the short run, some costs, especially wages, are fixed by contracts or are slow to change. Firms respond to higher prices by producing more, so the SRAS curve slopes upwards.
- Long-run aggregate supply (LRAS): In the long run, all prices and wages can adjust. Output depends on the economy's productive capacity, meaning its labour force, capital, technology and efficiency. LRAS is shown as a vertical line at the full-employment level of output, often labelled Yfe.
Shifts versus movements
This is the single most important distinction in AD/AS analysis, and it is where many students lose marks.
- A movement along a curve happens when the average price level changes. The economy moves up or down along the same AD or SRAS curve. Nothing about the curve itself has changed.
- A shift of a curve happens when a factor other than the average price level changes. The whole curve moves left (decrease) or right (increase).
A simple test: if the cause is the price level itself, you draw a movement. If the cause is anything else (interest rates, oil prices, government spending, confidence), you draw a shift.
Part 2: What Is a Shock?
In economics, a shock is an unexpected event that moves an economy away from its current equilibrium. Shocks are usually split into two types:
- Demand-side shocks change the total spending in the economy and shift the AD curve.
- Supply-side shocks change the costs or capacity of producers and shift the SRAS (and sometimes LRAS) curve.
Once you know which curve is affected, you can work out the effects on the price level and real output (real GDP).
Part 3: Demand-Side Shocks
Causes of shifts in AD
| Factor | Example | Effect on AD |
|---|---|---|
| Consumer confidence | Families feel secure about jobs and cut back on spending, or feel optimistic and spend more | Left (fall) or right (rise) |
| Interest rates | A rise makes borrowing dearer, reducing consumption and investment | Left if rates rise; right if they fall |
| Government spending | A new road-building programme increases G | Right |
| Taxes | A cut in income tax leaves households with more to spend | Right |
| Exports | Strong demand from overseas buyers raises export revenue | Right |
| Imports | A rise in imports (with exports unchanged) reduces net exports | Left |
| Exchange rate | A weaker currency makes exports cheaper and imports dearer | Right |
Effects of demand-side shocks
When AD shifts, the new equilibrium changes the average price level, real GDP, and usually unemployment and inflation.
- Positive demand shock (AD shifts right): Average price level rises, real GDP rises, unemployment falls and inflation tends to increase.
- Negative demand shock (AD shifts left): Average price level falls (or grows more slowly), real GDP falls, unemployment rises and inflation tends to fall.
Part 4: Supply-Side Shocks
Causes of shifts in SRAS
| Factor | Example | Effect on SRAS |
|---|---|---|
| Oil and energy prices | A rise in oil prices raises the cost of transport and production | Left |
| Wage costs | A rise in wages increases firms' costs | Left |
| Productivity | Better technology or training means more output per worker | Right |
| Indirect taxes | A rise in VAT or sales tax raises production costs | Left |
| Subsidies | Government support for producers lowers their costs | Right |
| Natural disasters | Floods or earthquakes destroy capacity or disrupt supply chains | Left |
Causes of shifts in LRAS
Some factors change the economy's long-run productive capacity. These shift LRAS:
- An increase in the size or skill of the labour force
- Investment in capital and infrastructure
- Technological progress
- Permanent changes in institutions or regulation
Remember that a natural disaster can shift SRAS left, and if it destroys lasting capacity, it can also shift LRAS left.
Effects of supply-side shocks
- Negative supply shock (SRAS shifts left): Average price level rises, real GDP falls, unemployment rises. This is the classic combination that leads to stagflation.
- Positive supply shock (SRAS shifts right): Average price level falls, real GDP rises, unemployment falls.
Part 5: Worked Examples With Diagrams
Diagrams are the heart of your answer. In words, here is how to draw and label each one. Always label the vertical axis Average price level (AP) and the horizontal axis Real national output (real GDP, Y). Label your equilibrium points clearly, such as P1/Y1 for the original and P2/Y2 for the new equilibrium.
Example 1: Positive demand shock
Scenario: The government announces a major infrastructure programme, increasing government spending.
Step by step:
- Draw the axes. Draw an upward-sloping SRAS curve and a downward-sloping AD1 curve. Mark the initial equilibrium where they cross at P1, Y1.
- Identify the cause. Government spending is not the price level, so this is a shift, not a movement.
- Shift AD to the right, to AD2. The new AD curve crosses SRAS at a higher output and higher price.
- Label the new equilibrium P2, Y2, where P2 is higher than P1 and Y2 is higher than Y1.
- Explain the effects: the price level rises, real GDP rises, and unemployment falls as firms hire more workers.
Example 2: Negative demand shock
Scenario: Consumer confidence collapses after a sudden fall in stock prices, and households save more and spend less.
Step by step:
- Draw the same axes, with SRAS and AD1 crossing at P1, Y1.
- Identify the cause. Lower consumer confidence changes consumption, which is a determinant of AD. This is a shift of AD.
- Shift AD to the left, to AD2.
- The new equilibrium is P2, Y2, where P2 is lower than P1 and Y2 is lower than Y1.
- Explain the effects: the price level falls (or inflation slows), real GDP falls, and unemployment rises as firms cut back production.
Example 3: Positive supply shock
Scenario: A new technology allows firms to produce more with the same workforce.
Step by step:
- Draw AD and SRAS1 crossing at P1, Y1.
- Identify the cause. Productivity is not the price level, so this is a shift of SRAS.
- Shift SRAS to the right, to SRAS2.
- The new equilibrium is P2, Y2, where P2 is lower than P1 and Y2 is higher than Y1.
- Explain the effects: prices fall, real GDP rises, and unemployment falls. This is the most favourable outcome for an economy.
Example 4: Negative supply shock
Scenario: Oil prices rise sharply because of a disruption in a major oil-producing region.
Step by step:
- Draw AD and SRAS1 crossing at P1, Y1.
- Identify the cause. Higher oil prices raise production costs for firms. This shifts SRAS, not AD.
- Shift SRAS to the left, to SRAS2.
- The new equilibrium is P2, Y2, where P2 is higher than P1 and Y2 is lower than Y1.
- Explain the effects: the price level rises (cost-push inflation), real GDP falls, and unemployment rises.
Practise drawing these four diagrams until you can do each one in under two minutes, with every label in place. Examiners look for clear axes, labelled curves, and labelled equilibria.
Part 6: Stagflation
Stagflation is the combination of stagnation (low or falling real output and high unemployment) and inflation (rising average price level). It is almost always caused by a negative supply shock.
Look back at Example 4. The price level rose (inflation) while real GDP fell (stagnation). This is why stagflation is so difficult for policymakers. Normally, fighting inflation involves slowing demand, but that would deepen the recession. Fighting unemployment involves boosting demand, but that would push prices even higher.
Stagflation was a major concern in many economies in the 1970s, when oil price shocks hit the global economy. It remains an important example in Economics exams because it shows the limits of demand management.
Part 7: Short-Run Versus Long-Run Effects
Many students draw a shock correctly in the short run and then forget what happens next. In a full answer, you should explain the long-run adjustment.
Demand shocks in the long run
Positive demand shock: When AD shifts right, output can rise above the full-employment level, Yfe. This means firms are working beyond their normal capacity. Shortages of workers push wages up. As wages rise, SRAS shifts left, and the economy returns to Yfe at a higher price level. The long-run effect on real output is zero, but prices stay permanently higher.
Negative demand shock: When AD shifts left, output falls below Yfe, and unemployment rises. Over time, wages fall (or grow more slowly). Lower costs shift SRAS right, and the economy returns to Yfe at a lower price level. In theory, the economy self-corrects, although in practice wages are often sticky downwards, so the adjustment can be slow and painful.
Supply shocks in the long run
A temporary negative supply shock, such as a short-lived spike in oil prices, may fade away. SRAS then shifts back to the right over time. However, a permanent shock, such as the loss of productive capacity from a natural disaster, can shift LRAS to the left. In that case, the economy settles at a lower level of potential output and a higher price level.
When you write a long-run analysis, always say whether the shock is temporary or permanent, because this determines the final outcome.
Part 8: Policy Responses
Responding to demand shocks
Demand-side shocks are the easier case for policymakers, because they can be managed by changing total spending.
- Fiscal policy: To counter a negative demand shock, the government can increase spending or cut taxes. To counter a positive demand shock that causes inflation, it can cut spending or raise taxes.
- Monetary policy: The central bank can change interest rates. To counter a negative demand shock, it can cut rates to encourage borrowing and spending. To counter inflation caused by a positive demand shock, it can raise rates.
Evaluation point: fiscal policy can take time to implement and may increase government debt, while monetary policy works with a time lag and can be less effective if confidence is very low.
Responding to supply shocks
Supply-side shocks are much harder to manage. The government faces a dilemma:
- If it boosts demand to reduce unemployment, prices rise even further.
- If it reduces demand to fight inflation, unemployment and output fall further.
Demand management alone cannot fix a supply problem, and it may worsen the trade-off.
Governments therefore often turn to supply-side policies, which aim to increase the economy's productive capacity over the long run. Examples include:
- Investment in education and training to raise productivity
- Investment in transport and energy infrastructure
- Reforms that encourage competition and innovation
- Support for research and development
Supply-side policies take years to show results, so they are a long-term response rather than a quick fix.
Part 9: Common Exam Mistakes and How to Avoid Them
Examiners see the same errors every year. Here is how to avoid them.
1. Confusing shifts with movements. Remember the test: if the price level changes, it is a movement along the curve. If anything else changes, it is a shift.
2. Mislabelling the axes. The vertical axis is the average price level, not the price of a single good. The horizontal axis is real output or real GDP, not nominal output.
3. Shifting the wrong curve. Oil prices shift SRAS, not AD. Government spending shifts AD, not SRAS. Check which curve the cause affects before you draw.
4. Forgetting that the equilibrium moves. Your answer should clearly show P1/Y1 moving to P2/Y2. Stating the direction of change without showing it on the diagram loses marks.
5. Ignoring the long-run adjustment. When a question asks you to analyse effects over time, or to evaluate, you should explain what happens in the long run. Students who stop at the short run often miss marks.
6. Using the word 'demand' loosely. Economists distinguish between demand for a single good (microeconomics) and aggregate demand (macroeconomics). Use the correct term in the correct context.
7. Describing without explaining. Writing 'AD shifts right and prices rise' is a statement. Writing 'Higher government spending increases total spending in the economy, so firms face greater demand and raise prices' is an explanation. Explanations earn the higher marks.
Part 10: Exam Technique for 'Discuss' and 'Evaluate' Questions
Many Unit 2 questions ask you to discuss or evaluate a policy or an effect. These require more than description. Here is a simple structure that works well.
Structuring a 'discuss' answer
- Introduction (briefly): Define the key term and state the basic idea.
- Analysis point 1: Explain the first effect, supported by a diagram.
- Analysis point 2: Explain a second effect or a contrasting view.
- Balance: Consider the arguments on both sides, such as short-run versus long-run effects.
- Conclusion: Reach a judgement based on the context of the question.
Structuring an 'evaluate' answer
Evaluation means weighing up evidence and reaching a reasoned judgement. Use these questions to guide your thinking:
- How big is the shock? A small shift has very different effects from a large one.
- How long will it last? Temporary and permanent shocks lead to different outcomes.
- What conditions are needed for the policy to work? For example, does the policy depend on confidence or on time lags?
- What are the trade-offs? Will reducing inflation increase unemployment?
- What else is happening in the economy at the same time?
Using real-world evidence
Real examples make your answer stronger. Refer to specific, recent data from reliable sources, such as national statistics offices, central banks, or international organisations. For example, you might refer to how oil price changes affected inflation in a particular year, or how a central bank's interest rate decisions affected consumer spending. Always state the country and time period, and be careful to use accurate figures.
When you use evidence, link it back to the theory. Explain how the data supports or challenges your analysis.
Evaluation points that earn marks
- Explain that the outcome depends on the size and duration of the shock.
- Consider whether the economy starts close to full employment or far below it.
- Note that the effectiveness of policy depends on time lags and on consumer and business confidence.
- Mention that there may be conflicting objectives, such as growth versus inflation.
- Judge which effect is most significant in the specific context of the question.
Part 11: Practice Questions
Try these questions on your own first. Use the guidance below to check your approach.
Question 1. Explain, using an AD/AS diagram, the effect of a rise in interest rates on the average price level and real GDP. (Hint: Identify which component of AD is affected by interest rates. Make sure you show a shift and label P1/Y1 and P2/Y2.)
Question 2. Explain why a rise in the cost of raw materials is likely to lead to stagflation. (Hint: Decide which curve shifts and in which direction. Consider what happens to the price level and to real output.)
Question 3. Discuss whether a government should use fiscal policy to respond to a fall in consumer confidence. (Hint: Use a 'discuss' structure. Consider the short run and the long run, and think about the limits of fiscal policy, including time lags and government debt.)
Question 4. Evaluate the view that supply-side policies are more effective than demand-side policies in tackling a permanent fall in the productive capacity of an economy. (Hint: Identify whether the shock is temporary or permanent. Consider the time frame of each policy type, and reach a clear judgement.)
Getting Support With Economics at EdFlik
AD/AS analysis rewards steady practice and clear feedback. Many students find that diagrams and evaluation become much easier when someone talks them through their reasoning, spots where a shift has been drawn as a movement, and helps them practise the long-run adjustment.
At EdFlik, we offer live, one-to-one online classes with experienced, certified teachers. Your child can work through diagrams together with a tutor, practise past paper questions, and build exam technique at a pace that suits them. Every new student can book a free trial class to see how it feels before committing. There is no pressure, and we are happy to match your child with a tutor who suits their learning style.
If you would like to explore support for Economics, you can find out more at www.edflik.com or get in touch with our team on WhatsApp or by email at support@edflik.com.