Analyzing Externalities and Public Goods: Essential IB Economics Diagrams for Paper 1 Success
Last Updated: October 2026 | By EdFlik Education Team
For students enrolled in the International Baccalaureate (IB) Diploma Programme studying Economics (SL or HL), Paper 1 presents a formidable challenge: the extended response essay. Across microeconomics, market failure is one of the most frequently tested core units.
When examiners open an IB Economics Paper 1 script, they are not looking for vague prose or generic descriptions of market inefficiency. They are searching for rigorous economic intuition anchored by precise, fully labeled diagrams. Whether analyzing negative externalities of production, positive externalities of consumption, or the under-provision of public goods, your ability to draw, label, and explain economic models determines your trajectory toward a grade 7.
In this comprehensive masterclass guide, our expert IB Economics educators break down the core market failure models, unpack the exact labeling requirements for top-tier diagrams, and share high-impact evaluation strategies.
Part 1: Why Diagrams Are the Heart of IB Economics Paper 1
In IB Economics, diagrams are not merely decorative illustrations meant to break up text; they are formal economic arguments. Under the official IB assessment criteria, Paper 1 essays are evaluated across three key rubrics:
- Criterion A (Knowledge and Understanding): Your ability to define key terms (e.g., externalities, marginal social benefit, market failure) and accurately reproduce economic models.
- Criterion B (Application): Your ability to use examples and integrate your diagrams directly into your written economic analysis.
- Criterion C (Synthesis and Evaluation): Your ability to evaluate government interventions (such as taxes, subsidies, or legislation) by discussing their effectiveness, unintended consequences, and stakeholder impacts.
If your diagram is missing key labels—such as deadweight loss triangles, welfare loss areas, or specific cost/benefit curves—your maximum achievable score under Criterion A is severely capped.
Part 2: Negative Externalities of Production (Negative Externality of Production Model)
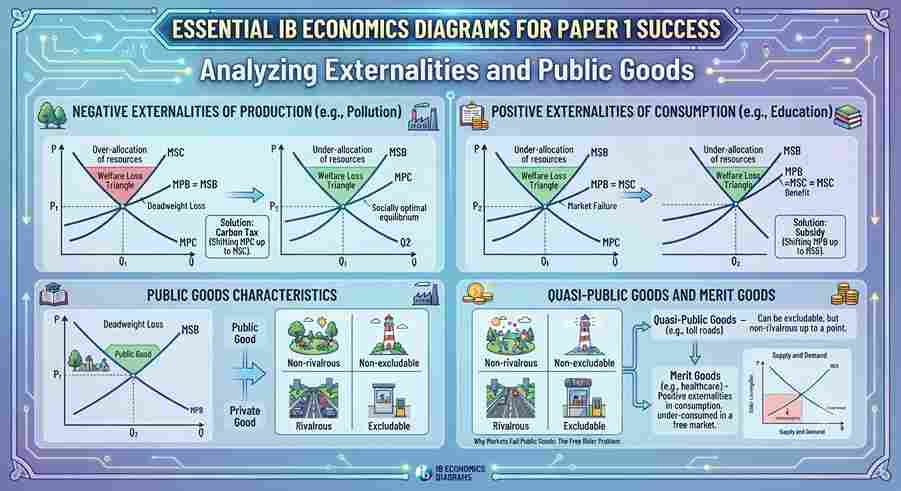
A negative externality of production occurs when the production of a good or service imposes uncompensated spillover costs on a third party not involved in the economic transaction (e.g., chemical manufacturing plants polluting a shared river ecosystem).
1. Understanding the Market Failure
Because private firms only factor in their private costs ($MPC$), they overproduce the good relative to what is socially optimal.
- Marginal Private Cost ($MPC$): The cost paid directly by the producer.
- Marginal External Cost ($MEC$): The cost inflicted on society.
- Marginal Social Cost ($MSC$): The true total cost to society, where $MSC = MPC + MEC$.
- Marginal Social Benefit ($MSB$): Assumed equal to Marginal Private Benefit ($MPB$) assuming no consumption externalities.
2. How to Draw the Diagram
- Axes: Vertical axis represents Cost / Price ($P$); horizontal axis represents Quantity ($Q$).
- Curves: Draw an upward-sloping supply curve labeled $MPC$ (or $S = MPC$) and a downward-sloping demand curve labeled $MSB = MPB$ (or $D$).
- Divergence: Draw a second supply curve above and to the left of $MPC$, labeled $MSC$. The vertical distance between $MSC$ and $MPC$ represents the $MEC$.
- Equilibrium vs. Optimum:
- The free-market equilibrium occurs where $MPB = MPC$, establishing market price $P_m$ and quantity $Q_m$.
- The socially optimum allocation occurs where $MSB = MSC$, establishing optimal price $P^*$ and quantity $Q^*$.
- Welfare Loss: Shade the triangular area between $MSC$ and $MSB$ to the right of $Q^*$ up to $Q_m$. This represents the welfare loss to society caused by overproduction.
Part 3: Positive Externalities of Consumption (Merit Goods)
Positive externalities of consumption occur when the consumption of a good or service creates uncompensated spillover benefits for third parties (e.g., getting vaccinated against an infectious disease or pursuing higher education).
1. Understanding the Market Failure
Because individual consumers only consider their private benefits ($MPB$), they under-consume the good or service relative to the socially optimal level.
- Marginal Private Benefit ($MPB$): The direct benefit enjoyed by the consumer.
- Marginal External Benefit ($MEB$): The positive spillover benefit enjoyed by society.
- Marginal Social Benefit ($MSB$): The true total benefit to society, where $MSB = MPB + MEB$.
2. How to Draw the Diagram
- Axes: Vertical axis represents Cost / Benefit ($P$); horizontal axis represents Quantity ($Q$).
- Curves: Draw an upward-sloping supply curve labeled $MSC = MPC$ (or $S$) and a downward-sloping private demand curve labeled $MPB$.
- Divergence: Draw a second demand curve above and to the right of $MPB$, labeled $MSB$. The vertical distance between $MSB$ and $MPB$ represents the $MEB$.
- Equilibrium vs. Optimum:
- Free-market equilibrium occurs at intersection $MPB = MPC$, giving $Q_m$.
- Socially optimal allocation occurs at intersection $MSB = MSC$, giving $Q^*$.
- Welfare Loss: The welfare loss triangle lies between $MSB$ and $MSC$ for the range of output between $Q_m$ and $Q^*$, illustrating the uncaptured net social benefits of under-consumption.
Part 4: Public Goods and Market Failure
Public goods represent a extreme form of market failure where the free market fails to provide any supply whatsoever due to two defining characteristics:
- Non-Excludability: Once the good is provided, it is impossible to exclude anyone from consuming it, whether they paid for it or not (e.g., national defense, street lighting).
- Non-Rivalry: Consumption of the good by one individual does not reduce the availability or amount left for anyone else.
The Free-Rider Problem
Because consumers know they cannot be excluded from enjoying a public good even if they do not pay, they have an economic incentive to free-ride. Consequently, private profit-maximizing firms see zero revenue potential, resulting in complete market failure (zero provision). This justifies government intervention through direct public sector provision funded by taxation.
Part 5: Top 4 Evaluation Pitfalls to Avoid in Paper 1
- Improper Curve Labeling: Never label curves with generic letters like $S_1$ and $S_2$ without explaining them. Always use proper IB notation: $MPC$, $MSC$, $MPB$, and $MSB$.
- Omitting Welfare Loss Triangles: Examiners specifically look for the shaded welfare loss triangle pointing back toward the socially efficient output ($Q^*$). Failing to shade and label this area loses evaluation marks.
- Confusing Production vs. Consumption Externalities: Remember that production externalities involve divergence in cost curves ($MPC$ vs. $MSC$), whereas consumption externalities involve divergence in benefit curves ($MPB$ vs. $MSB$).
- Describing Without Evaluating: In Part (b) of Paper 1 essays, students often describe a tax or subsidy diagram without discussing real-world limitations (e.g., difficulty in placing a monetary value on pollution or government administrative costs).
Struggling with IB Economics diagrams, market failure essays, or macroeconomic policies? EdFlik connects international school students globally with expert, 1-to-1 online economics tutors, helping you master analytical frameworks and secure top grade 7s.Book a Free Demo Class Today!
Frequently Asked Questions (FAQs)
Q1: What is the difference between merit goods and public goods?
Ans: Merit goods (like healthcare and education) are under-consumed in a free market due to positive externalities and imperfect information, but they can be provided by private markets. Public goods (like street lighting) suffer from non-excludability and non-rivalry, leading to complete non-provision by private markets.
Q2: How should I practice drawing IB Economics diagrams for exams?
Ans: Practice drawing every core diagram from memory on blank paper without looking at a textbook. Ensure your curves intersect cleanly, axes are fully labeled, and equilibrium points ($Q_m$ and $Q^-$) drop down clearly to the horizontal axis.
Q3: Are diagrams mandatory in IB Economics Paper 1 essays?
Ans: Technically, the mark scheme does not explicitly state "no diagram, zero points," but in practice, it is virtually impossible to access top-band scores (Criteria A and B) without integrating accurate, well-explained diagrams into your essay.
Q4: How does EdFlik support IB Economics students?
Ans: EdFlik connects international school students worldwide with vetted, expert 1-to-1 online economics tutors specializing in IB Diploma Programme SL and HL. Our personalized coaching focuses on diagram mastery, essay structure, and past-paper evaluation practice.