How to Calculate and Interpret Break-Even Charts in Cambridge A-Level Business
Last Updated: October 2026 | By EdFlik Education Team
For high school students completing Cambridge International AS & A Level Business (9609), financial analysis forms a core component of the syllabus. Featured prominently in Paper 2 (Data Response) and Paper 3 (Business Decision-Making), Break-Even Analysis is a fundamental quantitative decision-making tool that routinely accounts for calculation marks and extended evaluation questions.
Whether a manufacturing business is evaluating the launch of a new product line, analyzing the impact of rising raw material costs, or determining the sales volume needed to achieve a target profit margin, managers must understand the exact point where total revenues match total costs.
In this comprehensive, exam-focused masterclass guide, our expert Cambridge A-Level business educators break down the core formulas, provide step-by-step instructions for constructing break-even charts, explore the margin of safety, expose common examiner traps, and explain how to critically evaluate break-even analysis for an $A^*$ grade.
Part 1: The Foundations — Fixed Costs, Variable Costs, and Contribution
To master break-even calculations, you must first understand the relationship between different types of costs and revenue.
                      COST STRUCTURE IN BUSINESS
                                   |
      +----------------------------+----------------------------+
      |                                                         |
FIXED COSTS (FC)                                          VARIABLE COSTS (VC)
• Do NOT change with output                               • Change directly with output
• Examples: Rent, salaries, insurance                      • Examples: Raw materials, packaging, piece-rate labor
1. Contribution: The Core Concept
Before a business can make a profit, it must generate enough revenue to cover its Variable Costs. What remains after deducting variable costs from sales revenue is called Contribution. This remaining money "contributes" toward paying off Fixed Costs. Once fixed costs are fully covered, any additional contribution becomes pure profit.
Contribution Formulas:
- Contribution Per Unit:$$\text{Contribution Per Unit} = \text{Selling Price Per Unit} - \text{Variable Cost Per Unit}$$
- Total Contribution:$$\text{Total Contribution} = \text{Total Revenue} - \text{Total Variable Costs}$$OR$$\text{Total Contribution} = \text{Contribution Per Unit} \times \text{Number of Units Sold}$$
Part 2: Calculating the Break-Even Point
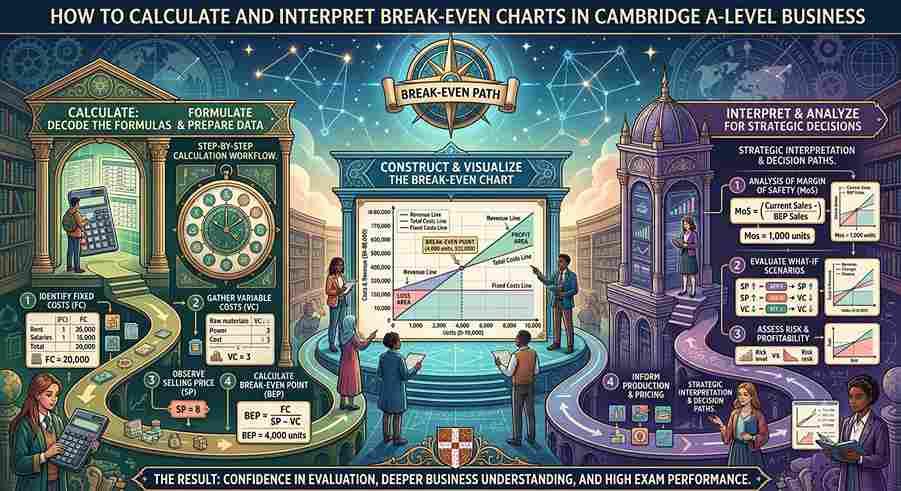
The Break-Even Point (BEP) is the precise level of output at which Total Revenue equals Total Costs ($\text{TR} = \text{TC}$). At this point, the business makes zero profit and zero loss.
1. Break-Even Formula (Units)
To calculate the exact number of units a business must produce and sell to break even:
$$\text{Break-Even Level of Output (Units)} = \frac{\text{Fixed Costs}}{\text{Contribution Per Unit}} = \frac{\text{Fixed Costs}}{\text{Selling Price Per Unit} - \text{Variable Cost Per Unit}}$$
2. Break-Even Revenue ($)
To find the total sales value required to break even:
$$\text{Break-Even Revenue} = \text{Break-Even Output (Units)} \times \text{Selling Price Per Unit}$$
3. Calculating Target Profit Output
Examiners on Cambridge Paper 2 and Paper 3 frequently ask: "How many units must the firm sell to achieve a profit of $50,000?" Modify the standard formula by adding the target profit to fixed costs:
$$\text{Target Profit Output (Units)} = \frac{\text{Fixed Costs} + \text{Target Profit}}{\text{Contribution Per Unit}}$$
Part 3: Constructing and Interpreting a Break-Even Chart
Constructing an accurate, fully labeled break-even chart on a Cambridge paper requires precision. Follow these exact structural guidelines:
    Revenue / Costs ($)
             ^                                     Total Revenue (TR)
             |                                    /
             |                                   / Total Costs (TC)
             |                                 ./
             |                               ./
   Break-Even|-----------------------------. (Break-Even Point)
     Revenue |                           ./|
             |                         ./  |
             |                       ./    |
             |                     ./      |
  Fixed Costs|-------------------./--------|------------ Total Fixed Costs (FC)
             |                 ./          |
             |               ./            |
             +--------------+--------------+--------------------> Output (Units)
             0          Break-Even
                          Output
Key Elements of a Break-Even Chart:
- Axes:
- X-axis (Horizontal): Output / Quantity (units).
- Y-axis (Vertical): Costs and Revenues ($).
- Fixed Cost Line (FC): A horizontal straight line starting at the fixed cost value on the y-axis, remaining flat regardless of output.
- Total Cost Line (TC): Starts at the Fixed Cost point on the y-axis (not at $0$) and slopes upward. ($\text{Total Cost} = \text{Fixed Costs} + \text{Total Variable Costs}$).
- Total Revenue Line (TR): Starts at the origin $(0,0)$ and slopes upward. ($\text{Total Revenue} = \text{Selling Price} \times \text{Output}$).
- Break-Even Point: The precise intersection where the TR line crosses the TC line.
- Profit and Loss Regions:
- The triangular area below the break-even point (where TC lies above TR) represents the Loss Region.
- The triangular area above the break-even point (where TR lies above TC) represents the Profit Region.
Part 4: The Margin of Safety
The Margin of Safety (MoS) measures the cushion a business has between its current (or projected) sales level and its break-even point. It indicates how much sales can fall before the business starts incurring a financial loss.
Formulas:
- Margin of Safety (Units):$$\text{Margin of Safety} = \text{Current / Planned Output} - \text{Break-Even Output}$$
- Margin of Safety (Percentage):$$\text{Margin of Safety (\%)} = \left( \frac{\text{Current / Planned Output} - \text{Break-Even Output}}{\text{Current / Planned Output}} \right) \times 100$$
Example: If a business plans to sell $5,000$ units and its break-even point is $3,500$ units:$$\text{Margin of Safety} = 5,000 - 3,500 = 1,500 \text{ units}$$
This means sales can drop by up to $1,500$ units before the business enters a loss-making situation.
Part 5: "What-If" Analysis (Sensitivity Analysis)
In Cambridge A-Level Business, examiners test whether you can predict how changes in economic or operational variables shift the break-even point:
| Scenario Change | Impact on Contribution Per Unit | Impact on Break-Even Point | Impact on Margin of Safety |
| Increase in Selling Price | Increases | Decreases (Breaks even faster) | Increases |
| Increase in Variable Costs (e.g., raw material inflation) | Decreases | Increases (Requires higher sales) | Decreases |
| Increase in Fixed Costs (e.g., rent increase) | Unchanged | Increases | Decreases |
| Decrease in Fixed Costs | Unchanged | Decreases | Increases |
Part 6: Critical Evaluation of Break-Even Analysis (AO4 Mastery)
To achieve Level 4 and Level 5 marks on Cambridge evaluation questions ("Evaluate the usefulness of break-even analysis to a business considering expansion..."), you must discuss both its benefits and severe practical limitations:
Advantages:
- Simple Visual Tool: Provides clear, immediate visual data for managers, bank lenders, and investors.
- Scenario & Risk Testing: Allows management to perform "what-if" analysis to evaluate potential price changes or cost fluctuations before making capital commitments.
- Assists in Securing Finance: Essential component of a formal business plan required by banks for loan approvals.
Limitations & Assumptions (Crucial for Evaluation):
- Assumes Static Conditions: Assumes that selling prices, fixed costs, and variable costs per unit remain constant across all output levels. In reality, variable costs per unit often decrease at higher outputs due to economies of scale (e.g., bulk-buying discounts).
- Assumes All Output Is Sold: Assumes every unit produced is immediately sold for revenue. It ignores inventory/stock holding, perishable goods, and unsold buffer stock.
- Multi-Product Complexity: Standard break-even analysis is designed for single-product businesses. For multiproduct firms with shared overhead costs (e.g., a supermarket), allocating fixed costs to individual products becomes highly arbitrary.
- Ignores External Market Dynamics: Assumes demand is linear and infinite. Raising the selling price lowers the calculated break-even point on paper, but in reality, higher prices reduce consumer demand due to Price Elasticity of Demand (PED).
Part 7: Top 4 Traps That Cost Students Marks in Cambridge Exams
- Starting the Total Cost Line at Origin $(0,0)$: Drawing the TC line starting from $0$ instead of starting at the Fixed Cost point on the y-axis. (Remember: Total costs equal fixed costs when output is zero!).
- Forgetting Units in Final Answers: Writing a numerical answer like
$1,250$when the question asks for break-even output ($1,250 \text{ units}$), or writing$1,250 \text{ units}$when asked for break-even revenue ($\$1,250$). - Confusing Contribution with Profit: Assuming Contribution equals Profit. Contribution must first cover all Fixed Costs before any Profit is realized.
- Failing to Label Axes Correctly: Labeling the y-axis simply as "Costs" instead of "Costs and Revenues ($)", or labeling the x-axis as "Time" instead of "Output / Quantity (Units)".
Preparing for Cambridge A-Level Business exams and aiming for an $A^$ grade? EdFlik connects international school students globally with expert, 1-to-1 online A-Level business tutors, helping you master financial ratios, corporate decision-making models, business strategy, and structured Paper 1 through Paper 4 exam techniques. *Book a Free Demo Class Today!
Frequently Asked Questions (FAQs)
Q1: What is the difference between direct costs and variable costs?
Ans: Direct costs are costs that can be directly attributed to a specific product or department (e.g., raw materials or direct wages). Variable costs are costs that vary directly with the level of output. Most direct costs are variable, but some direct costs can be fixed (e.g., leasing a specialized machine dedicated to one product line).
Q2: Can a business have a negative Margin of Safety?
Ans: Yes! A negative Margin of Safety indicates that the firm's current actual sales volume is operating below its break-even point, meaning the business is currently making a financial loss.
Q3: How does break-even analysis help in business planning?
Ans: It allows managers to determine the minimum operational threshold required to avoid financial losses. It helps set production targets, guide pricing strategies, evaluate risk before launching new products, and demonstrate financial viability to banks when applying for loans.
Q4: How does EdFlik support Cambridge A-Level Business students?
Ans: EdFlik connects international school students worldwide with vetted, expert 1-to-1 online tutors specializing in Cambridge International A-Level Business (9609). Our personalized coaching focuses on mastering quantitative decision tools, evaluating business strategies, and structuring high-scoring Paper 1 to Paper 4 essay responses.