IGCSE Economics Past Papers 0455 UAE 2026 — Diagrams, Data Response & Essay Technique
IGCSE Economics 0455 is one of the most popular subject choices at UAE British-curriculum schools — and one of the most technique-dependent. A student who understands economic theory thoroughly but draws unlabelled diagrams, writes one-sided evaluation essays, and answers data response questions without applying the stimulus data will consistently underperform. This guide provides UAE students with the past paper resources and the specific technique frameworks that Cambridge mark schemes reward.
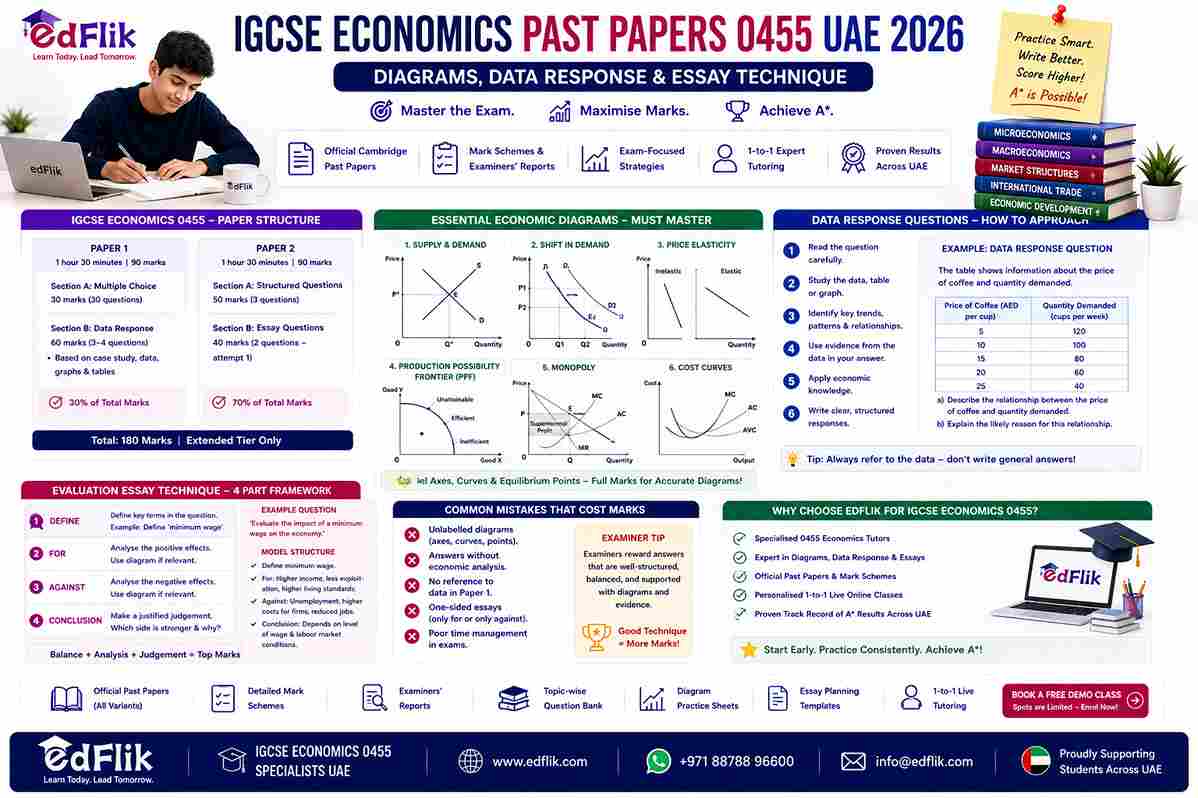
Cambridge IGCSE Economics 0455 — Paper Structure
|
Paper |
Duration |
Marks |
Content |
|
Paper 1 |
1 hr 30 min |
90 |
Section A: 30 multiple-choice questions (30 marks). Section B:
data-response questions based on stimulus material (60 marks) — 2 to 3
questions with structured parts |
|
Paper 2 |
1 hr 30 min |
90 |
Structured and essay questions — typically 4 questions, answer 3;
includes diagram questions, evaluation essays, and extended application
questions |
|
Total |
3 hrs total |
180 marks |
Both papers at Extended tier only (no Core option in Economics) |
Where to Download 0455 Past Papers Free
|
Source |
What's
Available |
|
PapaCambridge (pastpapers.papacambridge.com) |
Complete free archive of Papers 1 and 2 with mark schemes by year
and session |
|
PapersDaddy (papersdaddy.com) |
Question papers, mark schemes, examiner reports, grade thresholds |
|
Cambridge International (cambridgeinternational.org) |
Specimen papers, current syllabus, and some past papers — full
archive via School Support Hub |
The Diagram Labelling Checklist — Every Element Required for Full Marks
Unlabelled diagrams earn zero diagram marks in Cambridge IGCSE Economics 0455 regardless of how accurately the economic content is shown. Use this checklist for every diagram question:
|
Diagram Type |
Y-Axis Label |
X-Axis Label |
Curves/Lines
to Label |
Points to
Mark |
|
Supply and Demand (basic) |
Price (P) or Price (AED) |
Quantity (Q) |
D (demand curve); S (supply curve) |
Equilibrium E; equilibrium price P* with dashed line; equilibrium
quantity Q* with dashed line |
|
Shift in Demand |
Price (P) |
Quantity (Q) |
D1 (original); D2 (new — after shift) |
Original equilibrium E1; new equilibrium E2; old and new price
and quantity with dashed lines |
|
Price Elasticity |
Price (P) |
Quantity (Q) |
Label curve (D — elastic or D — inelastic) or draw two curves for
comparison |
Original and new price and quantity; percentage changes if
calculating PED |
|
Production Possibility Frontier |
Good A (name the good) |
Good B (name the good) |
PPF curve only — no label on the curve itself needed but the
curve must be concave |
Points: inside curve (point of inefficiency); on curve (point of
efficiency); outside curve (unattainable — label this) |
|
Monopoly diagram |
Price/Cost (P) |
Output/Quantity (Q) |
AR = Demand curve; MR below AR; MC (U-shaped); AC (U-shaped,
above MC minimum) |
Profit-maximising output where MR=MC; profit-maximising price on
AR curve; supernormal profit rectangle shaded (price above AC at that output) |
|
Cost curves |
Costs (£ or AED) |
Output (Q) |
MC curve (U-shaped); AVC curve (U-shaped, below AC); AC curve
(U-shaped) |
Minimum of AC where MC intersects from below; minimum of AVC
similarly |
Data Response Questions — How to Use the Stimulus
Paper 1 Section B data response questions provide stimulus material (tables, graphs, extracts from articles) and ask structured questions. The most consistent mark-losing error in data response: writing general economic theory without applying the specific data from the stimulus. Cambridge mark schemes explicitly award application marks for using specific figures, trends, or evidence from the stimulus material in your answer.
The correct approach for every data response question:
1. Read the stimulus carefully before reading the questions — identify the key trends, figures, and relationships in any data provided.
2. For each question, identify whether it asks for knowledge (define, state, identify), application (using the data), analysis (explaining causes or effects), or evaluation (judging the impact, considering both sides).
3. Use specific figures from the stimulus: 'The data shows that unemployment rose from 4.2% to 6.7%, suggesting...' earns application marks. 'Unemployment rose, which suggests...' without using the specific figures earns only knowledge marks.
4. For higher-mark questions (8 to 10 marks), always include: the economic theory; the application to the specific case study context; an analysis of cause-and-effect; and for evaluation-marked questions, a consideration of the other side.
Evaluation Essays — The Two-Sided Framework
Paper 2 evaluation essays are typically worth 8 to 12 marks and explicitly require considering arguments for and against a proposition. The four-part framework:
|
Part |
What to Write |
Marks
Available |
Common Error |
|
1. Define |
Define the key economic term or concept in the question — 'A
minimum wage is a legally enforced lowest hourly pay rate that employers must
pay workers' |
1 to 2 marks |
Skipping the definition entirely or writing a vague general
statement instead |
|
2. Argue FOR |
Present the economic argument in favour of the proposition —
mechanism + diagram if applicable — using specific examples |
3 to 4 marks |
Presenting only one narrow advantage without the economic
mechanism |
|
3. Argue AGAINST |
Present the economic counter-argument — mechanism + diagram if
applicable — showing the costs or limitations |
3 to 4 marks |
This is where most UAE students lose the most marks — they write
only one side |
|
4. Justified conclusion |
State your overall judgement and explain what factors (context,
time period, degree of intervention) determine which effect dominates |
2 to 3 marks |
Writing 'it depends' without specifying what it depends on |
High-Frequency Topics in 0455 Past Papers
|
Topic |
Paper 1 or 2 |
Frequency |
Key Technique |
|
Supply and demand — price mechanism |
Both |
Every paper |
Draw fully labelled diagram; show original and shifted
equilibrium; state price and quantity effects |
|
Inflation — causes and effects |
Both |
Every paper |
Distinguish demand-pull vs cost-push; use AD-AS if studying at IB
level; evaluate effects on different groups |
|
Unemployment — types and policies |
Paper 2 |
Most papers |
Define each type; match policy to type; evaluate policy
effectiveness with counter-argument |
|
International trade — advantages and disadvantages |
Paper 1 and 2 |
Most papers |
Apply comparative advantage correctly; evaluate free trade vs
protectionism with diagram of tariff/quota |
|
Market failure and government intervention |
Both |
Most papers |
Identify the market failure type; explain the intervention;
evaluate whether it corrects or creates additional inefficiency |
|
Economic growth — causes and consequences |
Both |
Most papers |
Use PPF and/or AD-AS diagram; evaluate positive and negative
consequences across different economic groups |
Frequently Asked Questions — IGCSE Economics Past Papers 0455 UAE
Q: What is the structure of Cambridge IGCSE Economics 0455?
A: Two papers, each 1 hour 30 minutes, each worth 90 marks (total 180). Paper 1: Section A (30 multiple choice, 30 marks) + Section B (data response, 60 marks). Paper 2: structured and essay questions (answer 3 from 4), including diagram questions and evaluation essays. No Core tier — all students sit Extended only.
Q: Why do UAE IGCSE Economics students lose the most marks?
A: Unlabelled diagrams — every axis, every curve, every equilibrium point must be labelled. An correctly drawn but unlabelled diagram earns zero diagram marks. Second most common: one-sided evaluation essays — Cambridge awards specific marks for the counter-argument and justified conclusion that a one-sided answer cannot earn regardless of how strong that one side is.
Q: How should UAE students write IGCSE Economics evaluation essays?
A: Four parts: (1) Define the key term. (2) Argue FOR the proposition with economic mechanism and diagram. (3) Argue AGAINST with counter-mechanism and diagram. (4) Reach a justified conclusion specifying what factors determine which effect dominates. 'It depends' without specifying what it depends on earns no conclusion marks.
Q: Which economic diagrams must UAE IGCSE Economics students master?
A: Six essential diagrams: supply and demand (with shift); price elasticity (elastic vs inelastic curves); production possibility frontier (inside/on/outside points); monopoly (AR, MR, MC, AC with profit rectangle shaded); cost curves (MC intersecting minimum of AVC and AC). Every element labelled — axes, curves, equilibrium points, dashed lines.
How EdFlik Supports IGCSE Economics 0455 Students Across UAE
EdFlik IGCSE Economics tutors focus on diagram technique and two-sided evaluation in every session — the two highest-yield improvements for UAE students. Sessions from AED 60 per class. Free demo. Book at www.edflik.com.