Mastering Digital SAT Command of Evidence Questions: Data-Driven Reading Framework
Last Updated: October 2026 | By EdFlik Education Team
For high school students preparing to tackle the Digital SAT Reading and Writing (RW) section—whether testing at international test centers across Dubai, Abu Dhabi, or worldwide—success requires shifting away from passive reading habits toward rigorous, forensic textual analysis.
Among all the question types featured in the RW module, "Command of Evidence" questions consistently prove to be one of the heaviest-weighted and most challenging hurdles. Whether the prompt asks you to find textual evidence to support a previous claim or demands that you evaluate a complex data table, bar chart, or scatterplot to complete a scientific hypothesis, students frequently fall into the trap of selecting answers that sound plausible rather than choices that are rigorously supported by the text or data.
In this comprehensive, exam-focused masterclass guide, our expert SAT reading strategists break down the anatomy of Command of Evidence questions, introduce a foolproof data-driven reading framework, and provide tactical execution steps to help you secure a top score.
Part 1: The Two Faces of Command of Evidence
On the Digital SAT, "Command of Evidence" questions are divided into two distinct sub-categories, each requiring a specialized mental toolkit:
1. Textual Evidence ("Which choice best supports the claim...?")
- The Format: You are given a short literary or scientific passage accompanied by a claim. The four answer choices consist of direct, verbatim quotes from different parts of the text.
- The Trap: Students often select quotes that are topically related to the general theme of the passage but fail to provide a direct logical bridge to the specific claim being tested.
2. Quantitative / Data-Driven Evidence ("Which choice most effectively uses data from the graph to complete the statement...?")
- The Format: You are given a short academic, sociological, or biological passage containing a blank, followed by a data graphic (bar graph, line chart, table, or scatterplot).
- The Trap: Students get intimidated by axis labels, units, or percentages, leading them to misread data trends or select answer choices that contradict the graph's actual numerical values.
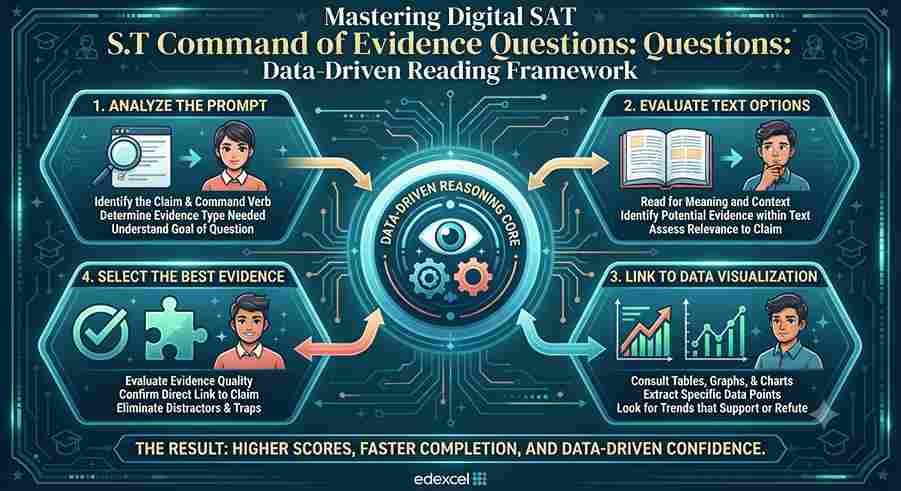
Part 2: The 4-Step Data-Driven Reading Framework
To consistently conquer quantitative Command of Evidence questions without falling for deceptive distractors, follow this repeatable four-step framework:
Step 1: Read the Claim/Blank First (Establish the Target)
Never start by staring blindly at the graph or reading every word of the passage. Look immediately at the sentence containing the blank. What is the author trying to prove?
- Example Target: Are they trying to show that species X declined in population after 2015, or that urban density increased energy efficiency? Know your target before looking at the data.
Step 2: Interrogate the Graphic (Read Axes, Units, and Trends)
Before looking at the answer choices, treat the graph like a crime scene:
- Read the Axis Labels: What are the units? (e.g., thousands of tons, percentage change, per capita income).
- Identify General Trends: Are variables moving directly (both increasing), inversely (one increases as the other decreases), or showing no correlation?
- Locate Key Data Points: Spot the maximums, minimums, or crossover points that relate directly to the passage claim.
Step 3: Predict the Data Match Before Looking at Options
Formulate an internal prediction based on what you see in the graph.
- Prediction Example: "The graph shows that agricultural carbon emissions dropped from 45% in 2010 to 30% in 2020." Having this concrete number in your head protects you from being persuaded by cleverly worded, incorrect answer choices.
Step 4: Test Answer Choices Against the Hard Data
Evaluate each answer option with rigorous skepticism. Does the choice accurately cite the numbers from the graph? Does it actually support the claim in the blank, or does it describe a different data point entirely? If an answer choice states a fact that is true according to the graph, but does not support the specific claim in the passage, it is incorrect.
Part 3: Mastering Textual Command of Evidence
When dealing with literary or historical text-based evidence questions, use the Prediction-Matching Method:
- Isolate the Claim: Read the question stem carefully and underline the exact assertion you need to prove.
- Formulate Your Own Proof: Based on your reading of the passage, where did the author state or imply this?
- Match Verbatim Quotes: Test each answer option (A, B, C, D) by asking: "Does this exact quote logically compel the conclusion stated in the claim without requiring an unreasonable leap in logic?"
Part 4: Top 4 Traps That Cost Students Points on Evidence Questions
- Selecting Factually True But Irrelevant Statements: Choosing an answer choice because it is an interesting fact mentioned in the passage, even though it has nothing to do with the specific hypothesis being tested.
- Misreading Inverse Trends in Graphs: Confusing an increase on the y-axis with a positive outcome when the passage is arguing a negative correlation, or misreading years on a timeline axis.
- Assuming Correlation Equals Causation: Falling for answer choices that overstate a data correlation into an absolute causal claim when the graph only shows statistical association.
- Rushing the Passage Stem: Skipping the contextual background of a study or experiment and jumping straight to the graph, leading to a complete misunderstanding of what variables are being measured.
Preparing for the Digital SAT and aiming for a top reading score? EdFlik connects international school students globally with expert, 1-to-1 online SAT tutors, helping you master evidence-based reading strategies, data analysis, and exam-day pacing. Book a Free Demo Class Today!
Frequently Asked Questions (FAQs)
Q1: How many Command of Evidence questions appear on the Digital SAT RW section?
Ans: Command of Evidence questions (both textual and quantitative) make up a substantial percentage of the Reading and Writing section—typically representing roughly 25% to 30% of all RW questions across both modules.
Q2: Do I need advanced statistical knowledge to answer quantitative evidence questions?
Ans: No. The Digital SAT does not test complex statistical formulas. You only need basic data literacy: reading bar heights, interpreting percentages, understanding scatterplot trends, and matching graph values to textual claims.
Q3: What is the best way to improve reading speed on evidence-heavy passages?
Ans: Stop reading the entire passage word-by-word at a uniform speed. Instead, practice active reading: skim the introductory context, identify the core thesis or scientific hypothesis, and focus heavily on sentence function and data graphics.
Q4: How does EdFlik support Digital SAT Reading and Writing preparation?
Ans: EdFlik connects international school students worldwide with vetted, expert 1-to-1 online SAT tutors. Our personalized coaching focuses on dissecting difficult evidence prompts, mastering grammar rules, building active reading stamina, and executing timed practice under test conditions.