IB Economics HL Paper 3 UAE 2026 — How to Score 7 on the Policy Paper
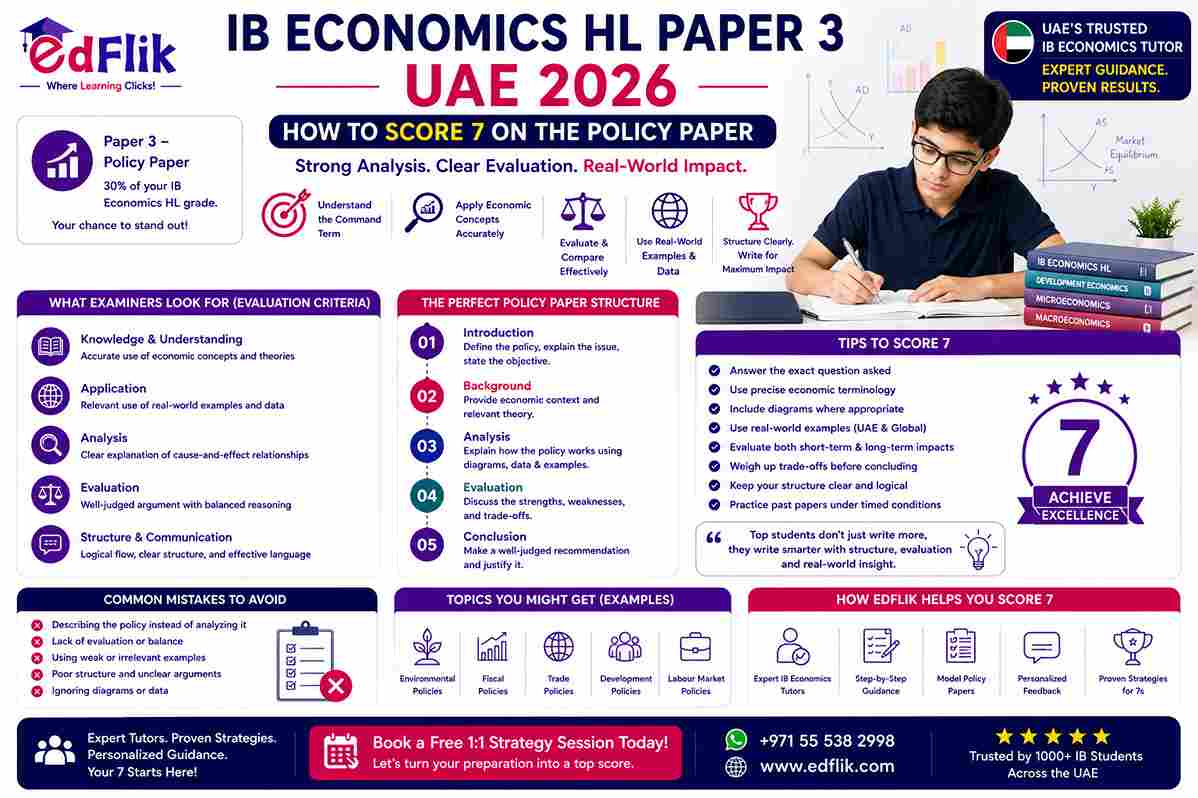
IB Economics HL Paper 3 is the examination that most differentiates grade 5 and 6 students from grade 7 students at UAE IB schools — Dubai International Academy, NLCS Dubai, GEMS World Academy, Repton IB stream, and Kings' School IB sixth form. Paper 3 is HL-only (SL students do not sit it) and contributes 30 percent of the total HL grade, making it the single highest-weighted component in the subject. Yet it is consistently the least prepared-for paper. Students who are comfortable with Paper 1 essays and Paper 2 data response often find that Paper 3's hybrid demand — calculations followed immediately by policy evaluation — requires a different kind of preparation that generic Economics revision does not provide.
Paper 3 Structure — What 30 Percent of Your Grade Looks Like
|
Component |
Marks |
Duration |
What's
Required |
|
Question 1(a) |
20 marks |
~45 minutes |
Calculations (percentage change, elasticity, exchange rate,
multiplier); short explanation questions (2–4 marks each); diagram
construction based on stimulus data |
|
Question 1(b) |
10 marks |
~30 minutes |
Structured policy recommendation or evaluation — most demanding
component; requires two-sided analysis, quantitative linkage, and justified
conclusion |
|
Question 2(a) |
20 marks |
~45 minutes |
Same format as Q1(a) but typically from a different syllabus area
— synoptic: can combine micro, macro, and international economics |
|
Question 2(b) |
10 marks |
~25 minutes |
Second policy recommendation or evaluation — same structure as
Q1(b) but for the second scenario |
|
Total |
60 marks |
1 hr 45 min |
30% of overall HL grade. Calculator required. Two compulsory
questions. Draws from all four syllabus units including HL extension. |
The Calculation Toolkit — Every Type UAE Students Must Master
Paper 3 part (a) is built around calculations. Show all working for every calculation — method marks are awarded for correct process shown even when the final number is wrong. A correct answer with no working earns only the answer mark.
|
Calculation
Type |
Formula |
UAE Student
Error to Avoid |
|
Price Elasticity of Demand (PED) |
PED = (% change in Qd) ÷ (% change in P) |
Forgetting the negative sign for normal goods (PED is negative);
confusing elastic (|PED| > 1) and inelastic (|PED| < 1) |
|
Price Elasticity of Supply (PES) |
PES = (% change in Qs) ÷ (% change in P) |
Using Qd instead of Qs; confusing direction of supply change |
|
Income Elasticity of Demand (YED) |
YED = (% change in Qd) ÷ (% change in income) |
Forgetting that negative YED = inferior good; positive YED > 1
= luxury good |
|
Tax incidence on consumer |
Consumer burden = price rise after tax (P₁ – P₀) |
Giving the total tax as the consumer burden; the consumer burden
is only the price rise portion |
|
Tax incidence on producer |
Producer burden = tax per unit minus consumer price rise |
Using the full tax as producer burden — must subtract consumer
portion |
|
Exchange rate conversion |
Multiply or divide the given amount by the exchange rate —
direction depends on which currency direction is asked |
Converting in the wrong direction — always state the formula used |
|
Multiplier |
k = 1/(1–MPC) = 1/(MPS+MPT+MPM) then: change in Y = k × change in
injection |
Using MPC directly as the multiplier; applying the multiplier to
the wrong injection change |
|
Percentage change |
% change = (new – old) ÷ old × 100 |
Dividing by new instead of old; not multiplying by 100 |
The 10-Mark Policy Question — Five Parts, Every Mark Accounted For
The part (b) policy question is worth 10 marks and is consistently the highest-scoring challenge on Paper 3. It requires a structured response that demonstrates definition, analysis, diagram use, evaluation, and judgement — in that order.
|
Part |
Marks |
What to Write |
Common Loss
of Marks |
|
1. Define |
1–2 |
Define the core economic concept in the question precisely — e.g.
'A minimum wage is a legally enforced price floor set above the equilibrium
wage rate' |
Vague definition that could apply to anything; omitting the
definition entirely and jumping straight to analysis |
|
2. Identify the problem from the stimulus |
2 |
State the economic problem the policy is designed to address
using specific figures from the stimulus — 'The data shows unemployment at
8.3%, above the natural rate, suggesting a deflationary gap' |
Generic statement of economic theory with no reference to the
specific stimulus data provided — loses application marks |
|
3. Recommend the policy with diagram |
3–4 |
Name the specific policy; explain the transmission mechanism (how
it works economically); draw a fully labelled diagram showing the effect;
state the expected outcome in terms of the stimulus data |
Mentioning the policy without the diagram; drawing the diagram
without labelling the shift, the new equilibrium, and the effect on
price/output/employment |
|
4. Evaluate — one advantage AND one disadvantage |
2–3 |
Present the strongest counter-argument to your recommendation;
consider time lags, stakeholder impacts, assumptions, effectiveness
conditions; reference the stimulus data in the counter-argument |
Writing only advantages of the recommended policy; one-sided
answers cap at 6 out of 10 regardless of quality |
|
5. Justified conclusion |
1 |
State which policy is most appropriate for this specific scenario
and give one specific reason tied to the stimulus context |
Vague conclusion ('it depends on the situation'); no link back to
the specific stimulus data or policy objective |
The Synoptic Challenge — Moving Between Frameworks Without Losing the Thread
The defining characteristic of Paper 3 — and the reason it challenges even strong Economics students — is that a single question can require students to apply microeconomic theory, macroeconomic policy, and international economics concepts within one integrated policy scenario. A UAE student who has compartmentalised revision by syllabus unit will struggle to maintain a coherent policy argument when the question moves from a microeconomic market failure in part (i) to the macroeconomic implications of the proposed intervention in part (iii) to the international trade effects in part (iv).
The pre-write map technique: before beginning to write any answer in Paper 3, spend 3 to 4 minutes mapping the scenario. Identify: what economic problem is present in the stimulus? Which syllabus unit does it belong to (micro, macro, international, development)? What are the likely policy levers? What are the likely trade-offs? What data in the stimulus is relevant to each part? This map prevents the most common Paper 3 failure — beginning a calculation-focused part (a) without understanding the policy direction that part (b) requires, then having to re-read the stimulus after losing 20 minutes of working time.
Diagrams on Paper 3 — The Labelling Checklist
Paper 3 diagram marks are awarded for correctness and completeness of labelling — identical to the IGCSE Economics principle. Every element must be labelled:
|
Diagram |
Y-Axis |
X-Axis |
Curves/Lines |
Points to
Mark |
|
Tax incidence — supply and demand |
Price (P) |
Quantity (Q) |
D; S (original); S₁ (after tax — supply shifts left by tax
amount) |
P₀ Q₀ (original equilibrium); P₁ (price paid by consumers after
tax); P₁ minus tax (price received by producers); consumer surplus
before/after; producer surplus before/after; deadweight loss triangle shaded |
|
AD-AS macroeconomic policy |
Price Level |
Real GDP / National Output |
AD (original); AD₁ (shifted — show direction); AS |
Original equilibrium Y₀ P₀; new equilibrium Y₁ P₁ — arrows
showing direction of change; full employment output Yf if relevant |
|
Phillips Curve inflation-unemployment trade-off |
Inflation Rate (%) |
Unemployment Rate (%) |
Short-run Phillips Curve (SRPC); Long-run Phillips Curve (LRPC —
vertical at natural rate) |
NRU (natural rate of unemployment) on x-axis; original and new
points on SRPC showing trade-off |
How to Use Past Papers for Paper 3 Preparation
Paper 3 past papers require a different practice method from Papers 1 and 2. The most effective sequence:
1. Read the full stimulus before attempting any question. Map the economic scenario, the policy context, and identify which syllabus units are being integrated.
2. Complete all part (a) sub-questions under timed conditions — approximately 45 minutes. Show all calculation working. Draw diagrams for any diagram sub-questions.
3. Complete the part (b) policy recommendation — approximately 30 minutes. Write all five structural elements explicitly.
4. Mark against the official IB mark scheme. For calculations, check: correct formula used, correct figures substituted, correct answer, correct unit where required. For part (b): check definition, application to stimulus, diagram accuracy, counter-argument present, conclusion justified.
5. For every mark lost in part (b), identify which of the five structural elements was missing. A student who consistently loses marks on the same element (usually the counter-argument or the justified conclusion) has identified the specific fix needed.
Frequently Asked Questions — IB Economics HL Paper 3 UAE
Q: What is IB Economics HL Paper 3 and how is it structured?
A: A 1 hour 45 minute, 60-mark policy paper contributing 30% of the HL grade. Two compulsory questions, each worth 30 marks divided into part (a) — 20 marks for calculations, data interpretation, and diagrams — and part (b) — 10 marks for a structured policy recommendation or evaluation. Calculator required. Draws from all four syllabus units including HL extension material.
Q: What calculation types appear in IB Economics HL Paper 3?
A: PED, PES, YED; tax incidence (consumer and producer burden separately); exchange rate conversion; multiplier calculations (k = 1/(1–MPC), then change in Y = k × change in injection); percentage change in price and quantity; current account balance calculations. All require full working shown — a correct answer with no working earns only the answer mark.
Q: How should UAE students structure the 10-mark Paper 3 policy question?
A: Five elements: (1) Define the key concept. (2) Identify the economic problem using specific stimulus data. (3) Recommend the policy with a fully labelled diagram. (4) Evaluate with one advantage AND one disadvantage (one-sided answers cap at 6/10). (5) Reach a justified conclusion tied to the specific stimulus context. Missing any element loses all marks allocated to it.
Q: What diagrams must UAE IB Economics HL students draw in Paper 3?
A: Tax incidence (supply and demand with tax wedge, consumer and producer burden, deadweight loss); AD-AS for macroeconomic policy; Phillips Curve for inflation-unemployment trade-off; Lorenz Curve for income distribution. Every diagram: labelled axes, labelled curves, original and new equilibrium points. Unlabelled diagrams earn zero.
How EdFlik Supports IB Economics HL Students Across UAE
EdFlik IB Economics HL tutors focus on Paper 3 technique from the first session — calculation drills, diagram labelling, and the five-part policy recommendation structure. Sessions from AED 70 per class. Free demo. www.edflik.com.