IGCSE Economics 0455 UAE — Diagram Drawing Guide with Complete Labelling Checklist
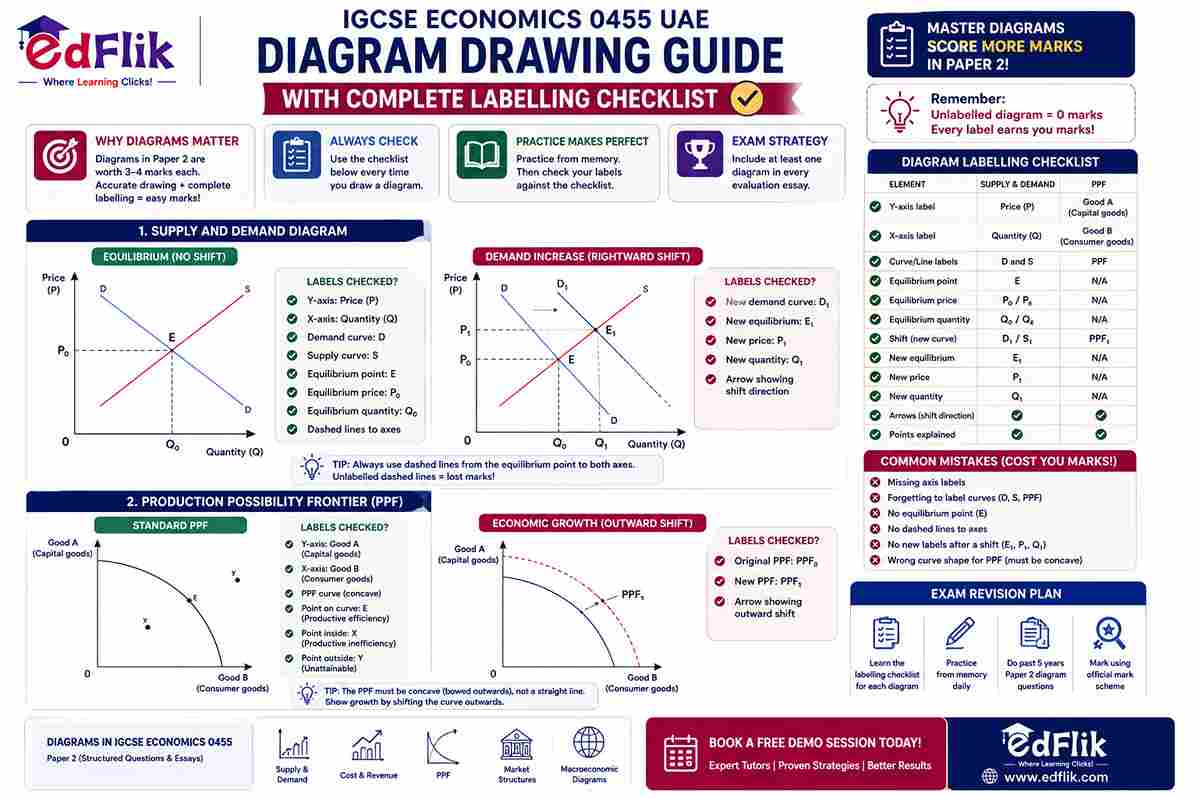
Diagram questions in Cambridge IGCSE Economics 0455 Papers 1 and 2 are responsible for more avoidable mark loss than any other single question type. The principle is stark: an unlabelled diagram earns zero diagram marks. Not reduced marks — zero. A student who draws a flawless supply and demand diagram showing a perfectly accurate market equilibrium, shift, and new equilibrium, but forgets to label the axes or the curves, earns nothing for the diagram. The economic knowledge is demonstrated. The marks are not earned. This guide provides the complete labelling checklist for every diagram type required in 0455 — the specific elements Cambridge awards marks for, every time.
The Core Rule — Every Element Must Be Labelled, Every Time
Cambridge IGCSE Economics 0455 mark schemes award separate marks for each labelled element of a diagram. This means:
• One mark for the y-axis label (correct economic variable with symbol).
• One mark for the x-axis label (correct economic variable with symbol).
• One mark for each curve or line label (D for demand, S for supply, etc.).
• One or two marks for equilibrium point(s) marked with dashed lines to both axes, labelled on both axes.
A student who draws the diagram correctly but omits the axis labels loses 2 marks. One who draws all curves but does not label them loses another 2 marks. This can amount to 4 out of 6 possible diagram marks lost on a single question — for a presentation error that takes 30 seconds to fix once the habit is built.
Complete Labelling Checklists by Diagram Type
Diagram 1 — Supply and Demand (Basic Equilibrium)
|
Element |
What to
Write/Draw |
Mark
Available |
✓ Check |
|
Y-axis label |
Price (P) or Price in AED, £, $ — matching the context |
1 mark |
□ |
|
X-axis label |
Quantity (Q) or Quantity demanded and supplied |
1 mark |
□ |
|
Demand curve |
Downward-sloping curve labelled 'D' at the end of the curve |
1 mark |
□ |
|
Supply curve |
Upward-sloping curve labelled 'S' at the end of the curve |
1 mark |
□ |
|
Equilibrium price |
Dashed horizontal line from intersection point to y-axis;
labelled P₀ or Pe on y-axis |
1 mark |
□ |
|
Equilibrium quantity |
Dashed vertical line from intersection point to x-axis; labelled
Q₀ or Qe on x-axis |
1 mark |
□ |
|
Equilibrium point |
Intersection of D and S labelled E or E₀ |
Optional — confirms equilibrium |
□ |
Diagram 2 — Shift in Supply or Demand
For a question requiring a shift (e.g. 'a rise in consumer income' for a normal good shifts demand right), draw BOTH the original equilibrium AND the new equilibrium:
|
Element |
What to
Write/Draw |
Common Error |
|
Original curves |
D and S labelled as above — original equilibrium E₁ with P₁ and
Q₁ |
Drawing only the new position without the original |
|
New demand/supply curve |
Label as D₂ (if demand shifts) or S₂ (if supply shifts) |
Labelling the new curve D or S without a subscript — loses the
mark for curve identification |
|
Direction of shift |
Arrow on the curve showing shift direction (right for increase,
left for decrease) |
Omitting the arrow — unclear which direction the shift occurred |
|
New equilibrium |
E₂ marked at intersection; P₂ on y-axis with dashed line; Q₂ on
x-axis with dashed line |
Drawing new equilibrium without dashed lines to axes — loses
price and quantity marks |
|
Axes and original labels |
All existing labels retained — do not erase original diagram
elements |
Erasing original equilibrium when adding new one |
Diagram 3 — Production Possibility Frontier
|
Element |
What to
Write/Draw |
Common Error |
|
Y-axis label |
Name of Good A (e.g. 'Capital goods' or specific good named in
the question) |
Labelling as 'Output' — too vague; must name the specific good |
|
X-axis label |
Name of Good B (e.g. 'Consumer goods') |
Same error — must name the good |
|
PPF curve |
Concave (bowed outward from origin) — NOT a straight line; goes
from y-intercept to x-intercept |
Drawing a straight line — a straight line PPF shows constant
opportunity cost; Cambridge 0455 expects concave curve for increasing
opportunity cost |
|
Point inside the PPF |
Label the point (e.g. A) and state its meaning: 'productive
inefficiency' or 'unemployment of resources' |
Drawing the point without labelling or explaining it |
|
Point on the PPF |
Label (e.g. B) — 'productive efficiency' or 'full employment of
resources' |
Not distinguishing between points inside and on the curve |
|
Point outside the PPF |
Label (e.g. C) — 'unattainable with current resources and
technology' |
Not marking an outside point when the question asks about it |
|
Economic growth — second PPF |
Draw an outward-shifted PPF; label as PPF₂; all original labels
retained |
Forgetting to label the shifted PPF separately |
Diagram 4 — Price Elasticity (Elastic vs Inelastic Demand)
|
Element |
Elastic
Demand |
Inelastic
Demand |
|
Y-axis |
Price (P) |
Price (P) |
|
X-axis |
Quantity (Q) |
Quantity (Q) |
|
Curve appearance |
Shallow gradient — more horizontal |
Steep gradient — more vertical |
|
Curve label |
D (elastic) or DE |
D (inelastic) or DI |
|
PED annotation if asked |
Draw a price change on y-axis; show the proportionally larger
quantity change — %ΔQ > %ΔP |
Draw a price change; show a proportionally smaller quantity
change — %ΔQ < %ΔP |
Diagram 5 — Market Failure (Negative Externality) — Extension
|
Element |
What to Draw |
Mark Note |
|
Private supply (MPC) |
Upward-sloping curve labelled MPC (Marginal Private Cost) |
MPC not MSC — these must be clearly distinguished |
|
Social supply (MSC) |
Upward-sloping curve labelled MSC (Marginal Social Cost) — above
MPC by the external cost |
MSC shifts left of (above) MPC to reflect the negative
externality |
|
Demand / marginal benefit |
Downward-sloping curve labelled MPB = MSB (for a negative
production externality, private and social benefit are equal) |
Label both MPB and MSB if they are equal |
|
Private equilibrium |
Where MPC and MPB intersect — labelled Qm (market quantity) and
Pm (market price) |
Using Q* for market output (reserve this for social optimum) |
|
Social optimum |
Where MSC and MSB intersect — labelled Q* (socially optimal
quantity) and P* |
Q* should be to the left of Qm for negative externality |
|
Welfare loss triangle |
Triangle between Q* and Qm — shaded to show deadweight welfare
loss |
Not shading the triangle; or shading the wrong area |
How to Use These Checklists in Revision
The most effective diagram revision protocol for UAE IGCSE Economics 0455 students:
1. For each diagram type above, cover the checklist completely. Draw the diagram from memory on blank paper. Check against the checklist — tick every element present, circle every element missing.
2. Repeat until every diagram can be drawn from memory with every element present. This typically takes 3 to 5 practice drawings per diagram type before it becomes automatic.
3. For every Paper 2 diagram question in past paper practice: complete the diagram; mark against the Cambridge mark scheme; for every diagram mark lost, identify which specific element was missing. Add that element to a 'missed elements' list.
4. Before any examination, spend 10 minutes reviewing the checklist for each diagram type — not drawing, just mentally rehearsing the element list. This activates the labelling habit without requiring additional drawing time.
Frequently Asked Questions — IGCSE Economics Diagram Guide UAE
Q: Why do UAE IGCSE Economics students lose marks on diagram questions?
A: Missing labels. An unlabelled diagram earns zero — not reduced marks. Cambridge marks each element separately: y-axis, x-axis, each curve, each equilibrium point. A perfectly drawn diagram with unlabelled axes loses the axis marks regardless of accuracy. This is a presentation habit, not a knowledge gap.
Q: How should UAE students draw and label a supply and demand diagram?
A: Six elements: (1) Y-axis: Price (P). (2) X-axis: Quantity (Q). (3) Demand curve labelled D. (4) Supply curve labelled S. (5) Equilibrium price P₀ with dashed horizontal line to y-axis. (6) Equilibrium quantity Q₀ with dashed vertical line to x-axis. For a shift: label new curve D₁ or S₁; mark new equilibrium E₁, P₁, Q₁ with dashed lines. Every element listed = every mark earned.
Q: How should UAE students draw the PPF for IGCSE Economics?
A: Y-axis: name of Good A. X-axis: name of Good B. Curve: concave (bowed outward) — not a straight line. Points: inside = productive inefficiency (label); on = productive efficiency (label); outside = unattainable (label). For economic growth: shifted outward PPF labelled PPF₂. Every element listed = every mark earned.
Q: What is the most effective revision method for Economics diagram questions?
A: Use these checklists: (1) Cover the checklist; draw from memory; check; repeat until complete. (2) In past paper practice, mark every diagram mark lost and identify which specific element caused it. (3) Always include at least one diagram in every Paper 2 essay response — diagram marks are earned independently of the written analysis.
How EdFlik Supports IGCSE Economics 0455 Students Across UAE
EdFlik IGCSE Economics tutors build the diagram labelling habit in the first session — using these checklists in every practice session. Diagram drills plus structured evaluation essays are the session format for every 0455 student. From AED 60. Free demo. www.edflik.com.