
Mastering Consumer and Producer Surplus Diagrams in Edexcel IAL Economics
Last Updated: October 2026 | By EdFlik Education Team
For high school students completing the Pearson Edexcel International Advanced Level (IAL) Economics specification—specifically Unit 1 (Microeconomics: Markets and How They Work)—mastering welfare economics and diagrammatic analysis is non-negotiable.
Whether appearing in multiple-choice questions, data-response quantitative items, or 12-mark and 20-mark essays, questions requiring you to draw, shift, and evaluate Consumer Surplus and Producer Surplus appear in almost every examination session. Students frequently lose top-band marks not because they don't understand market forces, but due to imprecise diagram labeling, inaccurate shading of welfare areas, or failing to evaluate the deadweight loss created by government interventions like taxes and tariffs.
In this comprehensive, exam-focused masterclass guide, our expert Edexcel IAL economics educators break down welfare foundations, provide a step-by-step diagram-drawing protocol, explore the impact of market distortions, expose common examiner traps, and supply a 100% copy-paste JSON-LD schema markup for your study resources.
Part 1: Defining the Core Concepts of Economic Welfare
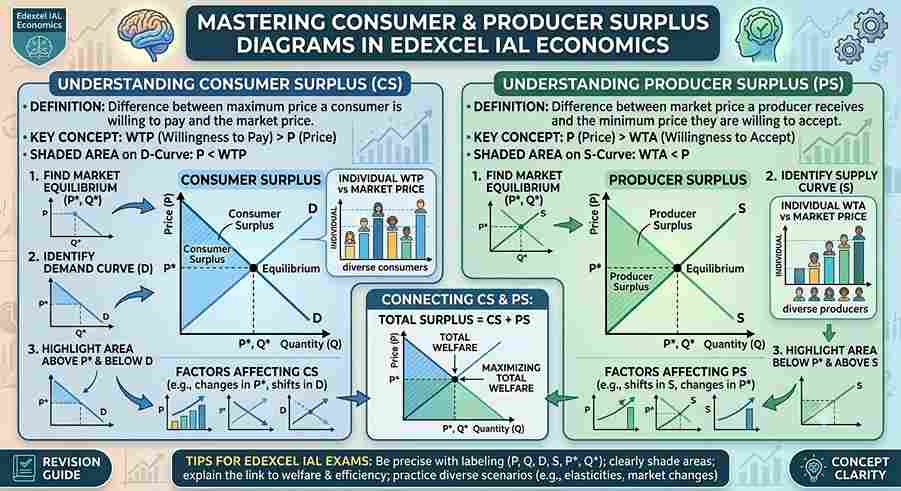
Before sketching a single curve, you must understand the exact definitions of economic surplus. Total welfare in a free market is composed of two primary components: Consumer Surplus and Producer Surplus.
                           TOTAL ECONOMIC WELFARE
                                     |
        +----------------------------+----------------------------+
        |                                                         |
CONSUMER SURPLUS (CS)                                    PRODUCER SURPLUS (PS)
• The difference between what consumers                  • The difference between what producers
  **are willing to pay** for a good and                    **are willing to accept** for a good and
  what they **actually pay** in the market.                what they **actually receive** (market price).
1. Consumer Surplus (CS)
Imagine you are willing to pay $20\$20$20 for a concert ticket, but you buy it at the market price of $12\$12$12. You have gained $8\$8$8 in consumer surplus. On a supply and demand diagram, consumer surplus is represented geometrically as the area below the demand curve and above the market price.
2. Producer Surplus (PS)
Producers have minimum supply prices based on their costs of production. If a firm is willing to supply a pair of shoes for $30\$30$30, but the prevailing market equilibrium price allows them to sell it for $50\$50$50, they capture a producer surplus of $20\$20$20. Geometrically, producer surplus is the area above the supply curve and below the market price.
Part 2: Step-by-Step Drawing Protocol for Equilibrium Surplus
When an Edexcel IAL question asks you to "draw a diagram to show consumer and producer surplus at market equilibrium," you must follow an exact geometric structure.
                  EQUILIBRIUM SURPLUS DRAWING PROTOCOL
                                   |
  Step 1: Draw Axes & Curves    ---> Label Price (P) on Y-axis, Quantity (Q) on X-axis. Downward Demand ($D$), Upward Supply ($S$).
  Step 2: Establish Equilibrium ---> Mark intersection point as Equilibrium Price ($P_e$) and Quantity ($Q_e$).
  Step 3: Shade Consumer Surplus---> Shade the triangle *above* $P_e$ and *below* the Demand curve.
  Step 4: Shade Producer Surplus--> Shade the triangle *below* $P_e$ and *above* the Supply curve.
Visualizing the Equilibrium Welfare Diagram:
  Price (P)
    ^
    |          Demand (D)
    |         / \
    |        /   \
 P_e |-------/-----\-------  <-- Market Equilibrium Price
    |      /   CS   \
    |     /-----------\
    |    /     PS      \
    |   /               \      Supply (S)
    |  /-----------------\
    +--------------------------> Quantity (Q)
             0      Q_e
- Area of Consumer Surplus: Triangle bounded by the Y-axis, the demand curve, and the horizontal line extending from PeP_ePe.
- Area of Producer Surplus: Triangle bounded by the Y-axis, the supply curve, and the horizontal line extending from PeP_ePe.
- Total Community Surplus: CS+PS\text{CS} + \text{PS}CS+PS, which is maximized in a free market at allocative efficiency (P=MCP = MCP=MC).
Part 3: Evaluating the Impact of Government Intervention on Surplus
Edexcel IAL Unit 1 examiners love testing whether students can analyze how market distortions—such as indirect taxes, subsidies, maximum prices, or import tariffs—reallocate or destroy economic welfare.
                WELFARE IMPACT OF AN INDIRECT TAX (EXCISE TAX)
                                       |
  Step 1: Supply Shifts Left    ---> Imposition of tax shifts Supply curve upwards ($S \rightarrow S + \text{tax}$).
  Step 2: Price Rises, Q Falls  ---> Equilibrium price increases to $P_2$, quantity drops to $Q_2$.
  Step 3: CS and PS Contract    ---> Consumer and producer surplus shrink significantly.
  Step 4: Deadweight Loss (DWL) ---> Portion of lost surplus becomes government tax revenue; remainder is
                                     permanently destroyed welfare (**Deadweight Loss**).
Part 4: Top 4 Traps That Cost Students Marks in Edexcel Economics
- Incorrectly Shading Surplus Triangles: Shading consumer surplus below the market price line or producer surplus above the price line. Always remember: Consumers sit above price; producers sit below price.
- Confusing Total Revenue with Producer Surplus: Shading the entire rectangle under the price line (0×Pe×E×Qe0 \times P_e \times E \times Q_e0×Pe×E×Qe) as producer surplus. Producer surplus is strictly the triangle above the supply curve, not the entire revenue rectangle.
- Omitting Deadweight Loss in Intervention Diagrams: Failing to shade and label the triangular deadweight loss (welfare loss) when analyzing taxes, tariffs, or monopolies on essay diagrams.
- Static Analysis Without Evaluation: Drawing a shifting diagram in an essay without evaluating the magnitude of the welfare loss or discussing whether government intervention achieves equity at the expense of economic efficiency.
Preparing for Pearson Edexcel IAL Economics Unit 1 exams and aiming for an $A^$ grade? EdFlik connects international school students globally with expert, 1-to-1 online economics tutors, helping you master market failure diagrams, essay structures, quantitative data-response items, and past-paper mark scheme strategies. *Book a Free Demo Class Today!
Frequently Asked Questions (FAQs)
Q1: What is the difference between consumer surplus and total utility?
Ans: Total utility is the total satisfaction a consumer derives from consuming a good. Consumer surplus is the net monetary benefit—the difference between what they were willing to pay based on that utility and what they actually paid in the marketplace.
Q2: Does maximum price (price ceiling) always decrease total welfare?
Ans: Yes. While a binding price ceiling helps low-income consumers who manage to purchase the good at a lower price, it creates market shortages, reduces producer surplus, and generates a deadweight loss due to allocative inefficiency.
Q3: How do price elasticities affect the size of consumer surplus?
Ans: When demand is price inelastic (steep demand curve), consumers place a very high valuation on the good, resulting in a much larger consumer surplus triangle compared to elastic demand curves.
Q4: How does EdFlik support Edexcel IAL Economics students?
Ans: EdFlik connects international school students worldwide with vetted, expert 1-to-1 online tutors specializing in Pearson Edexcel IAL Economics (Unit 1 to Unit 4). Our personalized coaching focuses on perfecting diagram precision, structuring 12-mark and 20-mark evaluation essays, and rigorous past-paper drilling.
More on A-Level
- A-Levels in the UAE: A Complete Guide to Boards, Subjects, Exams and University Entry
- Mastering Radians, Sectors, and Arcs: Edexcel IAL Pure Math 1 Exam Masterclass
- Mastering Investment Appraisal: Payback Period, ARR, and NPV for Edexcel IAL Business
- How to Evaluate Trading Blocs and Protectionism: Edexcel IAL Economics Unit 4 Essay Structure
- All A-Level articles