
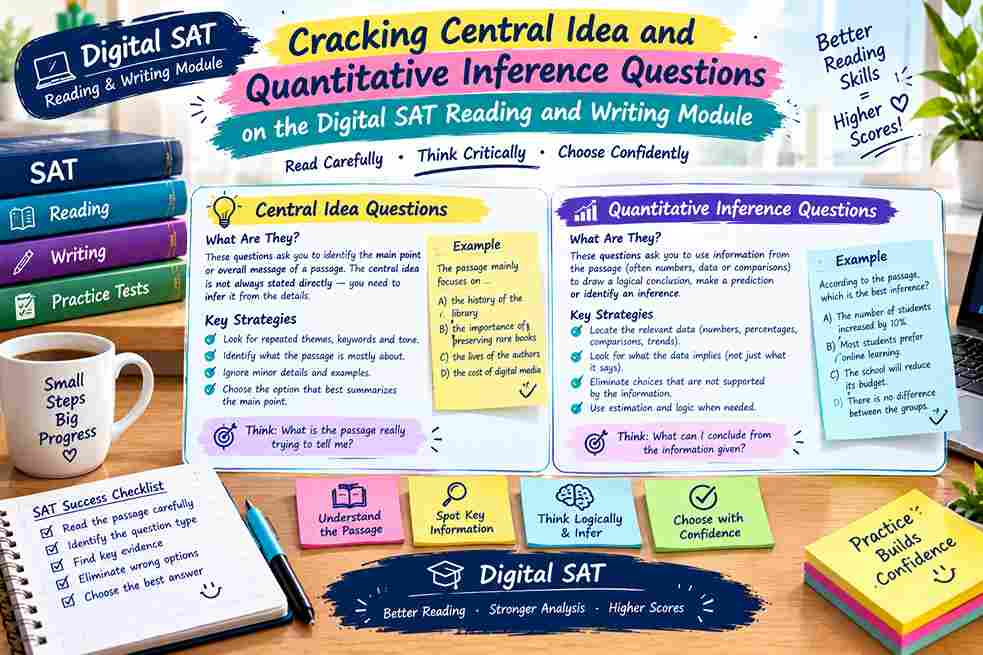
Cracking Central Idea and Quantitative Inference Questions on the Digital SAT Reading and Writing Module
Last Updated: October 29, 2026 | By EdFlik Team
For high school students preparing for the Digital SAT Reading and Writing (RW) module, mastering question typologies that demand high-level synthesis is essential for crossing the 700+ score threshold.
Among the various question types in the adaptive Digital SAT Bluebook software, two categories consistently separate top scorers from average test-takers: Central Idea Questions (testing macro-level comprehension and rhetorical purpose) and Quantitative Inference Questions (requiring students to bridge textual prose with data extracted from accompanying graphs, bar charts, or data tables).
Because the Digital SAT tests these skills under strict time constraints ($\sim 32$ minutes per 27-question module), students who rely on slow, line-by-line reading frequently run out of time or fall for sophisticated distractor options.
This comprehensive, exam-focused masterclass guide breaks down the core anatomy of Central Idea and Quantitative Inference questions, provides step-by-step solving protocols, walks through fully worked exam-style examples, exposes top student traps, and supplies a 100% copy-paste JSON-LD schema markup for your resource library.
Part 1: Deconstructing Central Idea Questions
Central Idea questions (often phrased as "Which choice best states the main idea of the text?" or "The primary purpose of the text is to...") evaluate your ability to step back from microscopic details and synthesize the overarching argument of a short prose passage.
                  ANATOMY OF A DIGITAL SAT CENTRAL IDEA ITEM
                                       |
        +------------------------------+------------------------------+
        |                                                             |
1. THE MACRO-ARGUMENT (THESIS)                                 2. THE SUPPORTING EVIDENCE
• Every SAT text has a single, cohesive                        • The first and last sentences often contain
  argument or explanatory focus.                                 the directional pivot or core claim.
• Must encompass the **entire** passage,                     • Discard options that focus exclusively on a
  not just a single compelling sentence.                         single supporting detail or example.
The 4-Step Central Idea Solving Protocol:
- Read the Question Stem First: Know whether you are looking for the central claim, the author's primary purpose, or the overall function of the text before reading the passage.
- Ignore the Distractors (Details): As you read the 4–6 sentence passage, mentally cross out specific dates, names, or localized data points. Ask yourself: "What is the author trying to prove here overall?"
- Formulate Your Own Answer: Before looking at the four multiple-choice options, state the main idea in your own words (e.g., "The author is arguing that ancient trade routes influenced language evolution faster than military conquest").
- Match to the Best Option: Select the choice that matches your paraphrase without introducing outside information or exaggerating the scope.
Part 2: Deconstructing Quantitative Inference Questions
A hallmark of the Digital SAT is the integration of data literacy directly into the Reading and Writing module. Quantitative Inference questions require you to use data from a provided graph, table, or bar chart to complete a sentence or validate a textual claim.
                    QUANTITATIVE INFERENCE WORKFLOW
                                   |
  Step 1: Inspect Axes and Units   ---> Check axis labels, scale intervals (linear vs. log), and units ($\text{kg}$, $\%$, millions).
  Step 2: Read the Text Claim      ---> Identify what relationship or trend the text is asserting.
  Step 3: Cross-Reference Data     ---> Locate the specific data points in the chart that support or refute the claim.
  Step 4: Select the Exact Match   ---> Choose the option that describes the data accurately without overgeneralizing.
Part 3: Fully Worked Exam-Style Walkthroughs
Example 1: Central Idea (Humanities / Social Science)
Passage Excerpt:
Historians have long characterized the mid-19th-century industrial transition in Western Europe as a period of absolute urban displacement, wherein agrarian workers were forcibly stripped of traditional communal lands and funneled into mechanized factories. However, recent archival excavations of regional tax records and parish registries reveal a more nuanced picture. Rather than immediate, permanent relocation, a dual-economy emerged: rural households frequently engaged in seasonal factory labor while maintaining small-scale artisanal agriculture. This hybrid participation buffered communities against industrial volatility, suggesting that economic modernization was an adaptive negotiation rather than a unilateral corporate imposition.
Question:
Which choice best states the main idea of the text?[A] Industrialization in 19th-century Western Europe completely eradicated traditional agricultural practices.[B] Archival tax records are more reliable than traditional historical narratives when studying European labor history.[C] Recent historical research demonstrates that 19th-century industrialization involved adaptive hybrid labor rather than simple worker displacement.[D] Seasonal factory workers earned higher wages than full-time agrarian farmers during the mid-19th century.
Solution Breakdown:
- Analysis: The passage sets up an old historical view ("absolute urban displacement") and contrasts it with recent findings ("dual-economy", "adaptive negotiation rather than unilateral corporate imposition").
- Evaluating Options: Choice [A] contradicts the text ("completely eradicated" is too extreme). Choice [B] focuses on a minor detail (tax records) rather than the main argument. Choice [D] mentions wages, which are never discussed in the text. Choice [C] perfectly captures the overarching synthesis: industrialization was an adaptive hybrid process rather than simple displacement.
- Correct Answer: [C]
Example 2: Quantitative Inference (Science / Data Integration)
Passage Excerpt & Data Summary:
Ecologists studying canopy microclimates in tropical rainforests measured the average daytime temperature variance ($\Delta T$) between unfragmented forest cores and forest edges over a 12-month period. While edge habitats experienced dramatic thermal fluctuations (averaging an increase of $4.2^\circ\text{C}$ during peak solar irradiance), unfragmented core regions maintained remarkably stable thermal profiles.Forest Core Average Variance: $+0.8^\circ\text{C}$Fragmented Forest Edge Average Variance: $+4.2^\circ\text{C}$Canopy Closure Density (Core): $94\%$Canopy Closure Density (Edge): $61\%$
Question:
Which choice most effectively uses data from the summary to complete the statement?
The ecological data directly support the hypothesis that canopy fragmentation increases thermal volatility because—[A] unfragmented forest cores exhibit lower canopy closure density than edge habitats.[B] edge habitats, characterized by reduced canopy closure, absorb and retain significantly higher solar radiation than stable cores.[C] temperature variance in core regions exceeds the thermal fluctuations recorded at forest edges.[D] forest edges experience lower peak solar irradiance than interior core habitats.
Solution Breakdown:
- Analysis: Look at the data points: Edge habitats have lower canopy density ($61\%$ vs $94\%$) and higher temperature variance ($+4.2^\circ\text{C}$ vs $+0.8^\circ\text{C}$).
- Evaluating Options: Choice [A] is factually backward (cores have higher closure density). Choice [C] contradicts the data (core variance is lower). Choice [D] is backward (edges experience higher solar irradiance). Choice [B] accurately links the reduced canopy closure ($61\%$) at edges to increased solar absorption and higher thermal volatility ($+4.2^\circ\text{C}$).
- Correct Answer: [B]
Part 4: Top 4 Traps That Cost Students Points on the Digital SAT RW Module
- The "True-But-Irrelevant" Detail Trap: Selecting an answer choice that states a fact directly mentioned in the passage, but which fails to answer the specific question or represent the main idea.
- Over-Extrapolating in Quantitative Questions: Drawing conclusions from a graph or table that go beyond what the data actually proves (e.g., assuming correlation equals causation when the chart only shows statistical association).
- Falling for Extreme Modifiers: Rejecting or accepting options containing absolute words like always, never, completely, or impossible, which rarely match nuanced academic texts.
- Misreading Chart Axes and Units: Failing to check whether a bar chart measures absolute values in thousands or percentage growth rates, leading to inverted interpretations.
Frequently Asked Questions (FAQs)
Q1: How many Quantitative Inference questions appear on the Digital SAT Reading and Writing module?
Ans: Typically, 2 to 4 questions per test form integrate graphical data (tables, bar graphs, or scatter plots) directly into the Reading and Writing section, testing your ability to synthesize prose with empirical evidence.
Q2: Should I read the passage or the graph first?
Ans: Always read the passage text and question stem first. Knowing what claim the prompt is testing allows you to scan the graph specifically for the data points that validate or refute that claim, saving valuable time.
Q3: Are advanced math calculations required for Quantitative Inference questions?
Ans: No. The math required is elementary (percentages, basic subtraction, comparing magnitudes, identifying trends). The challenge lies in reading comprehension and data literacy, not complex calculation.
More on American Curriculum, SAT & AP
- American Curriculum in UAE: Parent's Essential Guide
- SAT Reading and Writing Tutor Online: What to Look For
- Mastering Digital SAT Command of Evidence Questions: Data-Driven Reading Framework
- Digital SAT Practice Questions Online: Inside Edflik's Adaptive Eddy Tool
- All American Curriculum, SAT & AP articles