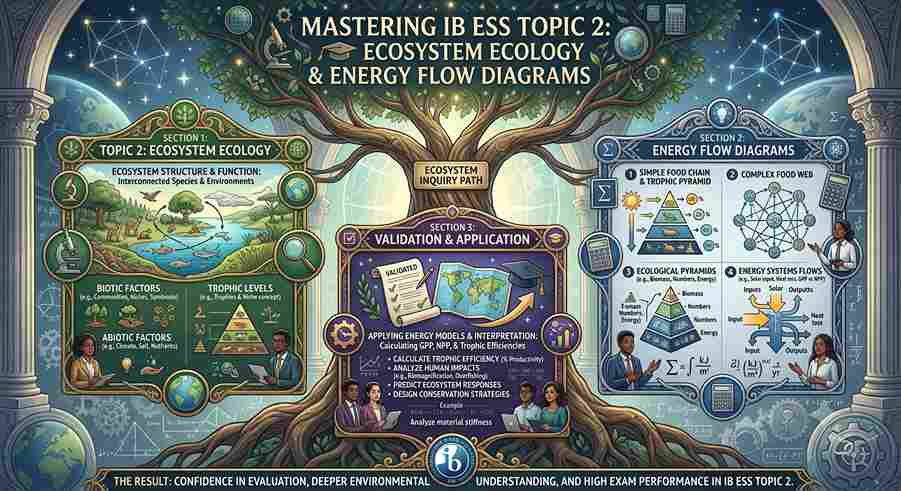
Mastering IB ESS Topic 2: Ecosystem Ecology and Energy Flow Diagrams
Last Updated: October 2026 | By EdFlik Education Team
For high school students enrolled in the International Baccalaureate (IB) Diploma Programme (DP), Environmental Systems and Societies (ESS)—offered at both Standard Level (SL) and Higher Level (HL)—is a rigorous transdisciplinary subject that bridges environmental sciences and societies. Among all core areas in the syllabus, Topic 2: Ecosystems and Ecology serves as the conceptual foundation for understanding how living organisms interact with each other and their physical environment.
Featured prominently across Paper 1 (case study data analysis) and Paper 2 (structured essays and data-response questions), Energy Flow Diagrams, Trophic Levels, and Ecological Pyramids routinely account for high-yield marks. Every exam session, students lose points not because they lack passion for environmental conservation, but because they confuse gross productivity with net productivity, misinterpret trophic efficiency calculations, or incorrectly draw energy pyramid boxes and arrows.
In this comprehensive, exam-focused masterclass guide, our expert IB ESS educators break down ecosystem energetics, thermodynamics laws, productivity calculations, energy flow diagram rules, and common examiner traps to help you secure a Level 7 grade.
Part 1: The Foundations — Ecosystems and the Laws of Thermodynamics
To understand how energy moves through an ecosystem, you must anchor your analysis in the fundamental laws of physics that govern all natural systems.
                    THE LAWS OF THERMODYNAMICS IN ECOLOGY
                                      |
      +-------------------------------+-------------------------------+
      |                                                               |
FIRST LAW OF THERMODYNAMICS                   SECOND LAW OF THERMODYNAMICS
Energy is neither created nor destroyed,      Energy transformations are never 100%
only transformed (Solar energy $\rightarrow$   efficient; usable energy is inevitably
Chemical bond energy via photosynthesis).     lost as dissipated heat to the surroundings.
1. The Flow of Energy vs. The Cycling of Matter
- Energy Flows: Energy enters ecosystems as solar radiation, flows in a one-way direction through trophic levels, and is progressively lost as heat respiration. It cannot be recycled.
- Matter Recycles: Chemical elements and nutrients (such as carbon, nitrogen, and water) are finite and continuously cycled between biotic and abiotic components through biogeochemical cycles.
Part 2: Ecosystem Productivity (GPP, NPP, GSP, NSP)
IB ESS students must master the precise definitions and mathematical relationships governing biomass and energy accumulation. Productivity is measured in units of energy or mass per unit area per unit time (e.g., $\text{J m}^{-2}\text{ yr}^{-1}$ or $\text{g m}^{-2}\text{ yr}^{-1}$).
                  PRODUCTIONS IN ECOSYSTEM DYNAMICS
                                   |
      +----------------------------+----------------------------+
      |                                                         |
PRODUCERS (Autotrophs)                                    CONSUMERS (Heterotrophs)
• Gross Primary Productivity (GPP)                        • Gross Secondary Productivity (GSP)
• Net Primary Productivity (NPP)                          • Net Secondary Productivity (NSP)
1. Primary Productivity (Plants / Autotrophs)
- Gross Primary Productivity (GPP): The total mass of organic matter fixed or converted from solar energy by photosynthesis per unit area per unit time in producers.
- Respiration ($R$): The energy lost by plants through cellular respiration to maintain metabolic functions.
- Net Primary Productivity (NPP): The actual dry mass (biomass) available to consumers after deducting plant respiration:$$\text{NPP} = \text{GPP} - R$$
2. Secondary Productivity (Animals / Heterotrophs)
- Gross Secondary Productivity (GSP): The total energy or biomass assimilated by consumers after food is ingested and indigestible material is egested.$$\text{GSP} = \text{Food Ingested} - \text{Feces (Egestion)}$$
- Net Secondary Productivity (NSP): The actual energy left over for consumer growth and reproduction after accounting for respiration:$$\text{NSP} = \text{GSP} - \text{Respiration } (R)$$
Part 3: Mastering Energy Flow Diagrams (Box and Arrow Models)
In Paper 2 exam questions, you will often be asked to complete or interpret an energy flow diagram for an ecosystem. Precision is everything: boxes represent storage compartments (trophic levels or abiotic pools), and arrows represent energy transfers or losses.
                TYPICAL ECOSYSTEM ENERGY FLOW DIAGRAM

   +-----------------------+
   |   Solar Radiation     |
   +-----------------------+
               |
               | (Incoming Sunlight)
               v
   +-----------------------+      Respiration (Heat)
   |  Level 1: Producers   |---------------------------> [ Lost to Environment ]
   +-----------------------+
               |
               | (Net Primary Production Consumed)
               v
   +-----------------------+      Respiration (Heat)
   |  Level 2: Herbivores  |---------------------------> [ Lost to Environment ]
   +-----------------------+
               |
               | (Secondary Production Consumed)
               v
   +-----------------------+      Respiration (Heat)
   | Level 3: Carnivores   |---------------------------> [ Lost to Environment ]
   +-----------------------+
               |
               v
     [ Decomposers / Detritivores ] -------> Heat Loss
Key Rules for Drawing Energy Flow Diagrams:
- Box Sizing / Proportionality: In quantitative diagrams, the width of boxes or arrows should be proportional to the quantity of energy flowing through them.
- Heat Losses: Every single trophic level must have an arrow branching outward representing energy lost as heat from respiration.
- Decomposers: Include a separate box or terminal arrow for decomposers and detritivores, which process dead organic matter and waste from all trophic levels.
- Units: Ensure all figures attached to arrows share consistent energy units (e.g., $\text{kJ m}^{-2}\text{ yr}^{-1}$).
Part 4: Ecological Pyramids (Numbers, Biomass, and Energy)
Ecological pyramids provide graphical representations of trophic structure in an ecosystem. IB ESS examines three distinct types:
                  THREE TYPES OF ECOLOGICAL PYRAMIDS
                                   |
        +--------------------------+--------------------------+
        |                          |                          |
  1. PYRAMID OF NUMBERS      2. PYRAMID OF BIOMASS      3. PYRAMID OF ENERGY
  Counts individual          Measures dry mass of       Measures total energy
  organisms per level.       tissue per level.          flow per level.
  Can be inverted (e.g.,     Can be inverted in         NEVER inverted; always
  1 oak tree feeds           marine systems (phytopl.   slopes upward due to
  1,000 caterpillars).       vs. zooplankton).          thermodynamic loss.
1. Calculating Trophic Efficiency
The efficiency of energy transfer between successive trophic levels is notoriously low—typically averaging $10\%$. The remaining $90\%$ is lost via respiration, egestion (feces), and unconsumed biomass.
$$\text{Trophic Efficiency (\%)} = \left( \frac{\text{Energy Transferred to Next Trophic Level}}{\text{Energy in Previous Trophic Level}} \right) \times 100$$
Part 5: Top 4 Traps That Cost IB ESS Students Marks
- Confusing GPP with NPP: Forgetting to subtract plant respiration ($R$) when asked to calculate Net Primary Productivity. Remember: $\text{NPP} = \text{GPP} - R$.
- Drawing Inverted Pyramids of Energy: Attempting to draw an inverted pyramid of energy on an exam diagram. Pyramids of energy can NEVER be inverted because of the Second Law of Thermodynamics.
- Omitting Heat Loss Arrows: Failing to label respiration or heat loss paths on energy flow diagrams. Energy transfer is inefficient; heat arrows must always point away from trophic boxes into the surrounding environment.
- Confusing Egestion with Excretion: Mixing up feces (egestion of undigested food, which forms part of GSP calculations) with metabolic waste products like urea or uric acid (excretion).
Preparing for IB ESS exams and aiming for a Level 7 grade? EdFlik connects international school students globally with expert, 1-to-1 online IB Environmental Systems and Societies tutors, helping you master ecological energetics, diagram interpretation, case study analysis, and structured essay techniques. Book a Free Demo Class Today!
Frequently Asked Questions (FAQs)
Q1: Why is the length of food chains typically limited to 4 or 5 trophic levels?
Ans: Due to the Second Law of Thermodynamics, roughly $90\%$ of energy is lost at each trophic level as heat during respiration, or left uneaten/egested. After 4 or 5 transfers, insufficient energy remains to support a viable population of top apex predators.
Q2: Can a pyramid of biomass ever be inverted?
Ans: Yes! In certain aquatic ecosystems (such as open ocean waters), microscopic phytoplankton have rapid reproduction rates and short lifespans, meaning their standing crop biomass at any single moment is smaller than the biomass of the zooplankton consuming them. However, a pyramid of energy for that same ecosystem remains upright.
Q3: What is the difference between an autotroph and a heterotroph?
Ans: Autotrophs (producers like plants and algae) manufacture their own organic compounds from inorganic substances using light (photosynthesis) or chemical energy (chemosynthesis). Heterotrophs (consumers like herbivores and carnivores) must ingest other organisms to obtain pre-formed organic molecules.
Q4: How does EdFlik support IB ESS students?
Ans: EdFlik connects international school students worldwide with vetted, expert 1-to-1 online tutors specializing in IB DP Environmental Systems and Societies (SL/HL). Our personalized coaching focuses on clarifying complex ecological systems, mastering data-response calculations, evaluating environmental case studies, and structuring high-scoring ESS essays.