
Decoding Cladistics and Cladogram Construction: IB Biology Molecular Phylogeny Guide
Last Updated: October 2026 | By EdFlik Education Team
For high school students completing the International Baccalaureate (IB) Diploma Programme (DP) Biology qualification—across both Standard Level (SL) and Higher Level (HL)—Topic B3.2 (Cladistics and Classification) represents one of the most high-yield conceptual domains within the revamped IB Biology curriculum.
Whether appearing on Paper 1 (Data-based and Multiple-Choice Questions) or Paper 2 (Data-Based and Extended Response Questions), questions on evolutionary relationships, molecular clocks, cladogram construction, and reclassification based on amino acid or DNA sequencing demand absolute clarity.
Every exam session, capable biology students lose vital marks because of precise mark-scheme traps: confusing analogous and homologous structures, failing to trace common ancestors on clade nodes, or miscalculating evolutionary distance from molecular alignment tables.
In this comprehensive, exam-focused masterclass guide, our expert IB Biology educators break down the core principles of cladistics, explore step-by-step cladogram construction, analyze molecular phylogeny, expose top examiner traps, and supply a 100% copy-paste JSON-LD schema markup for your study resources.
Part 1: Deconstructing Cladistics and Clade Architecture
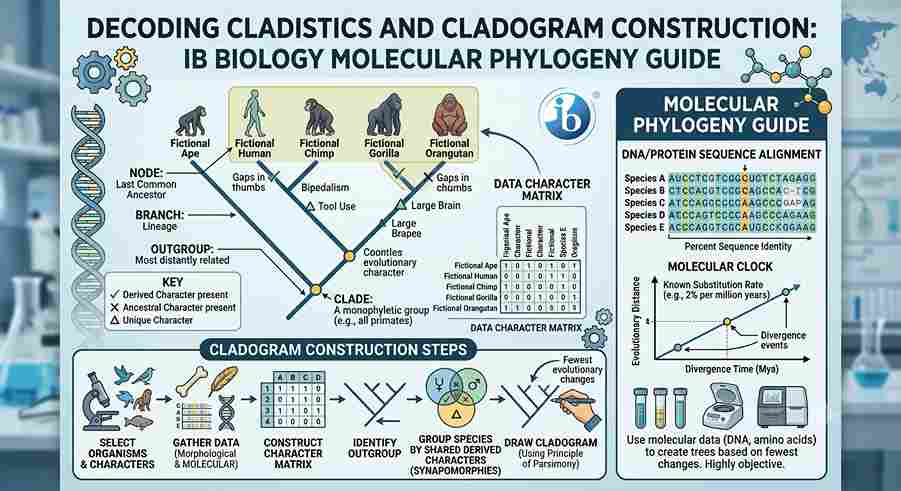
Cladistics is a system of biological classification that groups organisms based on shared characteristics derived from a common ancestor. A group of organisms consisting of an ancestral species and all of its descendants is defined as a clade.
                       CLADISTICS ARCHITECTURE & TERMINOLOGY
                                         |
      +----------------------------------+----------------------------------+
      |                                                                     |
1. CLADE (MONOPHYLETIC GROUP)                                         2. NODES (BRANCHING POINTS)
• Includes a single ancestral species and                             • Represents a speciation event where an ancestral
  **ALL** of its evolutionary descendants.                              lineage split into two distinct species.
      |                                                                     |
      +----------------------------------+----------------------------------+
                                         |
      +----------------------------------+----------------------------------+
      |                                                                     |
3. ROOT                                                               4. OUTGROUP
• The initial common ancestor shared by                               • A closely related taxon that branched off before
  all organisms depicted in the cladogram.                              the clade under study (used as a reference).
Homologous vs. Analogous Structures: The Foundation of Modern Phylogeny
Before the advent of gene sequencing, taxonomists classified species based on physical morphology. However, structural similarities can often be deceiving:
                    STRUCTURAL COMPARISON IN TAXONOMY
                                   |
        +--------------------------+--------------------------+
        |                                                     |
HOMOLOGOUS STRUCTURES                                  ANALOGOUS STRUCTURES
• Features shared by species due to **common ancestry**.• Features shared by species due to **convergent evolution**.
• Result of **divergent evolution** (e.g., pentadactyl   • Adapted to similar ecological niches/selection pressures
  limb in humans, bats, and whales).                     (e.g., wings of birds vs. wings of insects).
• **VALID** for building true cladograms.               • **INVALID** for cladistics (leads to polyphyletic errors).
Part 2: Molecular Phylogeny and the Molecular Clock
Modern cladistics relies predominantly on molecular evidence—specifically comparing base sequences of DNA/RNA or amino acid sequences of proteins (such as Cytochrome c or Hemoglobin) across different species.
                    THE MOLECULAR CLOCK CONCEPT
                                   |
  Step 1: Gene Mutations Accumulate ---> Neutral point mutations accumulate at a relatively constant rate.
  Step 2: Sequence Divergence      ---> The longer two species have been separated, the more differences exist.
  Step 3: Evolutionary Time Plot   ---> Sequence differences correlate directly to time since common ancestor.
Key Principles of the Molecular Clock:
- Mutation Rate: Mutations in non-coding DNA or neutral amino acid positions occur randomly over long time scales at a roughly predictable rate.
- Quantifying Divergence: By aligning DNA or amino acid sequences, scientists count the number of base/amino acid substitutions.
- Calibrating Time: Using fossil records to establish exact dates for specific nodes, the rate of substitution is calibrated to estimate the precise time (in millions of years) since two clades diverged.
Part 3: Step-by-Step Cladogram Construction Protocol
Examiners regularly present a data matrix of traits or sequence differences and ask candidates to construct a cladogram or deduce evolutionary relationships.
Step 1: Analyze the Character Matrix
Consider the following hypothetical presence ($+$) or absence ($-$) table of traits for five animal taxa:
| Taxon | Vertebral Column | Amniotic Egg | Hair | Opposable Thumbs |
| Lamprey (Outgroup) | $-$ | $-$ | $-$ | $-$ |
| Shark | $+$ | $-$ | $-$ | $-$ |
| Lizard | $+$ | $+$ | $-$ | $-$ |
| Tiger | $+$ | $+$ | $+$ | $-$ |
| Chimpanzee | $+$ | $+$ | $+$ | $+$ |
Step 2: Identify Derived Characters and Nested Hierarchy
- Outgroup: The Lamprey lacks all derived traits and branches off first at the base of the cladogram.
- Shared Derived Trait 1 (Vertebral Column): Shared by Shark, Lizard, Tiger, and Chimpanzee.
- Shared Derived Trait 2 (Amniotic Egg): Shared by Lizard, Tiger, and Chimpanzee.
- Shared Derived Trait 3 (Hair): Shared by Tiger and Chimpanzee.
- Shared Derived Trait 4 (Opposable Thumbs): Unique to Chimpanzee (autapomorphy).
Step 3: Draw the Cladogram
  Lamprey      Shark       Lizard      Tiger     Chimpanzee
     |           |           |           |           |
     |           |           |           |           |---- Opposable Thumbs
     |           |           |           |-----------|
     |           |           |           |---- Hair
     |           |           |-----------|
     |           |           |---- Amniotic Egg
     |           |-----------|
     |           |---- Vertebral Column
     |-----------|
     |
  (Root / Ancestor)
Part 4: The Figwort Family Reclassification (Classic IB Case Study)
The most famous IB Biology exam example of cladistics revolutionizing taxonomy is the reclassification of the Figwort Family (Scrophulariaceae).
                THE SCROPHULARIACEAE RECLASSIFICATION
                                   |
  BEFORE MOLECULAR ANALYSIS         ---> Combined species based on morphological similarity
                                         (flower shape, seed structure).
  MOLECULAR ANALYSIS (Chloroplast Gene)---> DNA sequencing of chloroplast genes revealed 5 distinct
                                         clades that evolved convergently.
  AFTER RECLASSIFICATION            ---> Major rehousing: species split into Plantaginaceae,
                                         Orobanchaceae, Linderniaceae, and Paulowniaceae.
Key Takeaway for IB Exams: Traditional plant classification based on flower structure was flawed because similar floral adaptations evolved independently multiple times (convergent evolution). DNA sequence analysis provided an objective, true reflection of evolutionary ancestry.
Part 5: Top 4 Traps That Cost Students Marks in IB Biology
- Assuming Higher Nodes Mean "More Advanced": Thinking that species on the far right of a cladogram are more evolved than species on the left. All terminal taxa at the ends of branches are contemporary species that have evolved for the same length of time from their common root.
- Confusing Branch Lengths: In standard cladograms, branch length is arbitrary and only shows topological relationships. Only in phylograms does branch length represent proportional evolutionary time or genetic distance.
- Misattributing Convergent Traits to Clades: Grouping birds and bats together because both have wings. Wings are analogous structures formed via convergent evolution, not derived homologous traits from a common flying ancestor.
- Incorrect Node Identification: Miscounting the number of common ancestors when asked which two species are most closely related. Two species are most closely related if they share the most recent common ancestor (the closest node).
Preparing for IB Biology SL or HL exams and aiming for a grade 7? EdFlik connects international school students globally with expert, 1-to-1 online IB Biology tutors, helping you master molecular genetics, cladistics, data-based questions, and past-paper Paper 1 and Paper 2 strategies. Book a Free Demo Class Today!
Frequently Asked Questions (FAQs)
Q1: What is the main difference between a cladogram and a phylogenetic tree?
Ans: A cladogram shows only the branching order and relative relationships among clades without specifying absolute evolutionary time. A phylogenetic tree incorporates branch lengths proportional to time or amount of genetic change.
Q2: How do mitochondrial DNA (mtDNA) and nuclear DNA differ for molecular clocks?
Ans: Mitochondrial DNA (mtDNA) mutates at a rapid rate and does not undergo recombination, making it ideal for studying recent evolutionary divergence (e.g., human population lineage). Nuclear DNA or ribosomal RNA (rRNA) mutates slowly, making it suited for analyzing ancient evolutionary events millions of years ago.
Q3: What does a monophyletic group mean?
Ans: A monophyletic group (or clade) consists of an ancestral species and all of its evolutionary descendants. If any descendant group is excluded, the classification becomes paraphyletic, which is invalid in strict cladistics.
Q4: How does EdFlik support IB Biology students?
Ans: EdFlik connects international school students worldwide with vetted, expert 1-to-1 online tutors specializing in IB Biology SL and HL. Our personalized coaching covers core theory, data-based question analysis, internal assessment (IA) mentorship, and targeted past-paper drilling.
More on IB