
IGCSE Statistics: Averages from Tables, Grouped Data and Cumulative Frequency
Last updated: November 2026 | By EdFlik Education Team
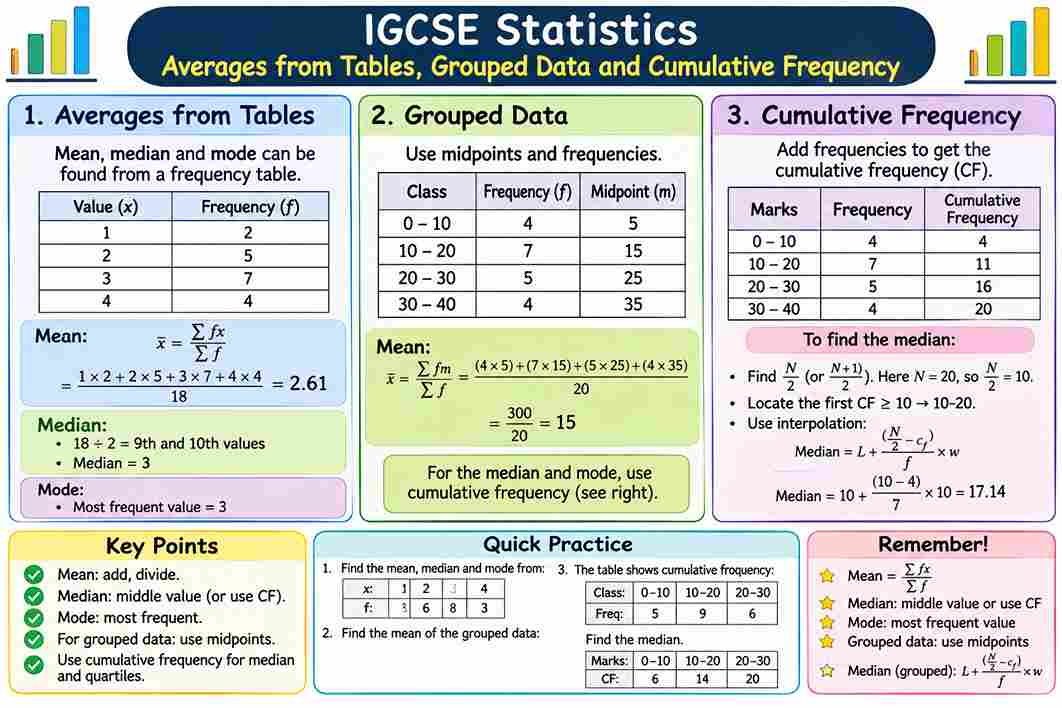
Statistics questions combine arithmetic with careful reading. This guide covers averages from frequency tables, estimates from grouped data, cumulative frequency and quartiles, and comparing distributions.
The averages
Average |
How to find it |
Strength |
Mean |
Total of values ÷ number of values |
Uses every value; affected by extremes |
Median |
Middle value when ordered |
Not affected by extremes |
Mode |
Most frequent value |
Works for non-numerical data |
Range |
Largest − smallest |
A simple measure of spread |
Worked example 1: simple list
Data: 4, 7, 7, 9, 13. Mean = 40 ÷ 5 =8. Median =7. Mode =7. Range = 13 − 4 =9.
Averages from a frequency table
Worked example 2
Score x |
Frequency f |
f × x |
1 |
3 |
3 |
2 |
5 |
10 |
3 |
8 |
24 |
4 |
4 |
16 |
5 |
2 |
10 |
Total |
22 |
63 |
- Mean = 63 ÷ 22 =2.86(3 s.f.).
- Median position = (22 + 1) ÷ 2 = 11.5th value. Cumulative frequencies are 3, 8, 16, so the 11th and 12th values are both 3. Median =3.
- Mode =3, the highest frequency.
Estimating the mean from grouped data
Use the midpoint of each class, because you do not know the exact values. The result is an estimate.
Worked example 3
Class |
Frequency |
Midpoint |
f × midpoint |
0 to 10 |
4 |
5 |
20 |
10 to 20 |
6 |
15 |
90 |
20 to 30 |
8 |
25 |
200 |
30 to 40 |
2 |
35 |
70 |
Total |
20 |
|
380 |
- Estimated mean = 380 ÷ 20 =19.
- The modal class is the class with the highest frequency:20 to 30.
Cumulative frequency, median and quartiles
Cumulative frequency is a running total. For the data above the cumulative frequencies at the upper class boundaries 10, 20, 30, 40 are 4, 10, 18, 20. Plot each against its upper boundary and join with a smooth curve.
- Median: read the value at n ÷ 2 = 10, which is about20.
- Lower quartile: read at n ÷ 4 = 5, which is about 11.7.
- Upper quartile: read at 3n ÷ 4 = 15, which is about 26.3.
- Interquartile range = upper quartile − lower quartile = 26.3 − 11.7, about14.6.
These are estimates read from the graph (or by interpolation), so answers within a small tolerance are accepted.
Box plots
A box plot shows five values: the minimum, lower quartile, median, upper quartile and maximum. The box covers the middle 50% of the data; the interquartile range is the length of the box.
Comparing two sets of data
- Compare one average(usually the median) andone measure of spread(interquartile range or range).
- Write the comparison in context: "The median score for class A is higher, so class A scored higher on average. Class A has a smaller interquartile range, so its scores are more consistent."
Common mistakes
- Using the class width instead of the midpoint to estimate the mean.
- Plotting cumulative frequency against the lower boundary.
- Using the frequency column to find the median instead of the position.
- Comparing without using a number or a measure of spread.
Practice questions
Question |
Answer |
1. Find the mean of 4, 7, 7, 9, 13. |
8 |
2. Scores 1, 2, 3 with frequencies 2, 3, 5. Find the mean. |
(2 + 6 + 15) ÷ 10 = 2.3 |
3. Find the range of 4, 7, 7, 9, 13. |
9 |
4. A class has frequency 8 and midpoint 25. What is its contribution to f × midpoint? |
200 |
Frequently asked questions
Q: How do I estimate the mean from grouped data?
Multiply each midpoint by its frequency, add the results and divide by the total frequency.
Q: What is cumulative frequency?
A running total of frequencies, plotted against the upper class boundary.
Q: What is the interquartile range?
The upper quartile minus the lower quartile, the spread of the middle half of the data.
Q: Why is the mean from grouped data only an estimate?
The exact values within each class are unknown, so midpoints are used.
Try a free trial class with EdFlik. Live 1:1 IGCSE tutoring for Cambridge and Edexcel students in the UAE, matched to your child's board, subject and year group. Book at edflik.com or message us on WhatsApp. |
Related reading
- IGCSE Probability: Trees, Venn and Conditional
- IGCSE Maths 8-Week Mock Revision Plan
- Edexcel 4MA1 Past Papers
Sources
- Cambridge International IGCSE Mathematics 0580 syllabus (statistics)
- Pearson Edexcel International GCSE Mathematics A 4MA1 specification
More on IGCSE & GCSE
- IGCSE in the UAE: A Complete Guide to Boards, Subjects, Exams and Revision
- IGCSE Economics Tutor: How to Master Data Response and Essay Questions (2026 Guide)
- IGCSE Science Practical Skills: Variables, Tables, Graphs, Planning and Evaluating
- Drawing Truth Tables from Complex Logic Statements in Cambridge IGCSE Computer Science
- All IGCSE & GCSE articles